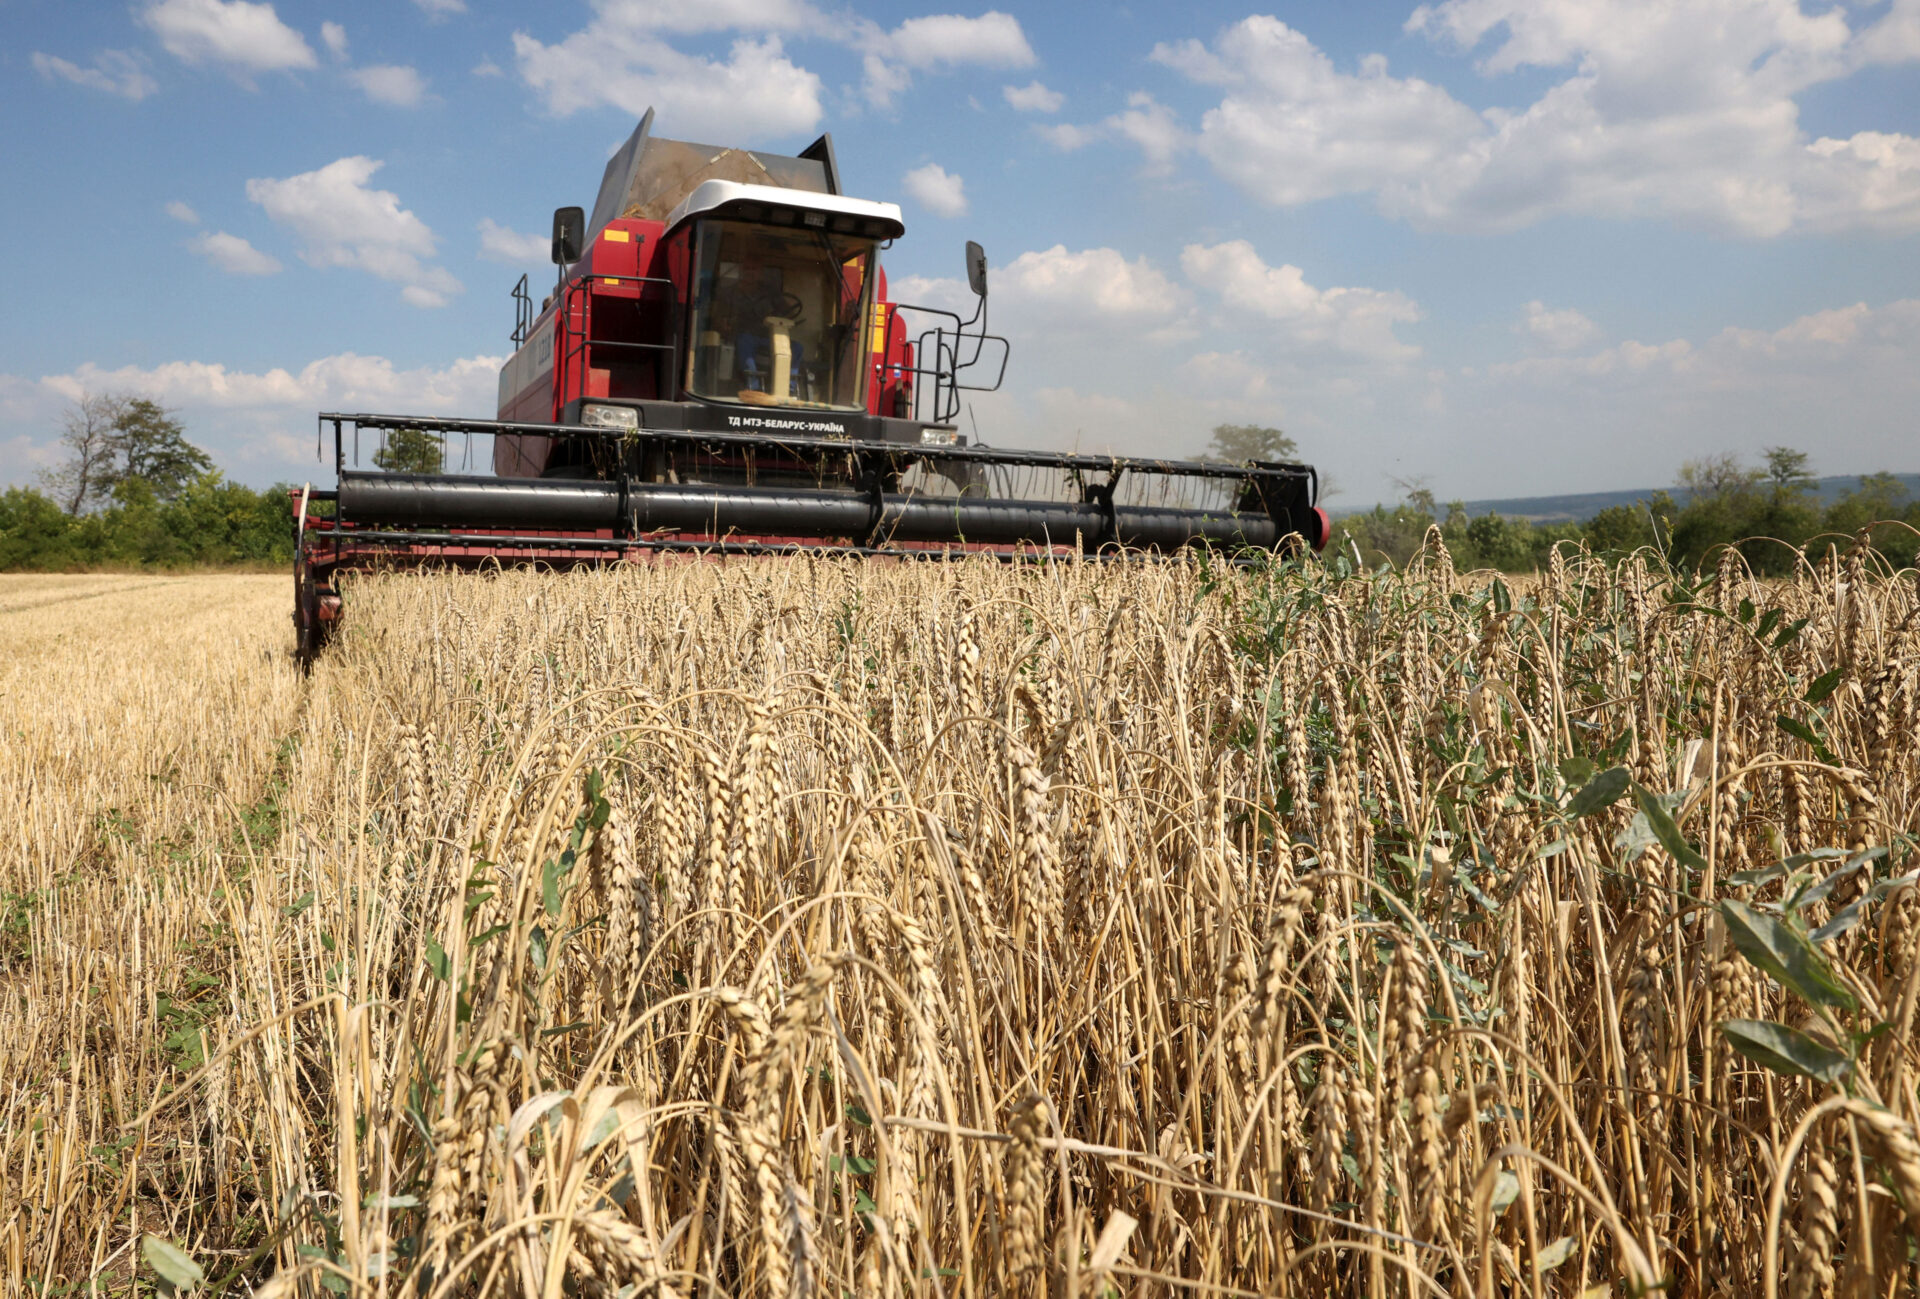
The value of agricultural production in the EU fell by 0.9% in 2024 – European Newsroom
Analysis of European Union Agricultural Production in 2024 and its Alignment with Sustainable Development Goals
Economic Performance and Sustainable Growth (SDG 8)
A report based on Eurostat data indicates that the value of agricultural production in the European Union (EU) was €531.9 billion in 2024. This represents a nominal decrease of 0.9% from 2023, marking the second consecutive year of a slight decline. However, the gross value added by the agricultural sector, a key indicator for SDG 8 (Decent Work and Economic Growth), increased by 3.1% to reach €228.6 billion. This suggests an improvement in the sector’s economic productivity and its contribution to sustainable economic growth despite the marginal fall in overall production value.
- Total Production Value: €531.9 billion
- Year-on-Year Change: -0.9%
- Gross Value Added: €228.6 billion (+3.1%)
Production Dynamics, Food Security, and Farmer Livelihoods (SDG 2)
The change in nominal value reflects a complex interplay between production volume and pricing, which has direct implications for SDG 2 (Zero Hunger). This goal aims to end hunger, achieve food security, improve nutrition, and promote sustainable agriculture. The data reveals:
- A 1.0% increase in the volume of agricultural production, a positive step towards ensuring food availability.
- A 1.8% decrease in the nominal price of agricultural products, which poses a challenge to the economic viability of farms and the target of doubling the income of small-scale food producers (SDG Target 2.3).
The production value was primarily derived from two main sources, both central to food systems and nutrition:
- Crops: €267.7 billion (50.3% of total value)
- Animals and Animal Products: €218.8 billion (41.1% of total value)
Resource Efficiency and Sustainable Production Patterns (SDG 12)
In a development relevant to SDG 12 (Responsible Consumption and Production), the costs of agricultural inputs not related to investment (intermediate consumption) decreased. Total intermediate consumption was €303.3 billion, a 3.7% reduction compared to 2023. This decrease may indicate a move towards greater resource efficiency and more sustainable production methods within the EU agricultural sector, aligning with the goal of achieving the sustainable management and efficient use of natural resources.
Regional Performance and Implications for Rural Development (SDG 1 & SDG 10)
The distribution of agricultural production value remains concentrated, with significant variations across member states. These disparities impact progress towards SDG 1 (No Poverty) and SDG 10 (Reduced Inequalities), as the agricultural sector is vital for rural livelihoods.
Top Producing Member States
Seven member states accounted for 75.9% of the EU’s total agricultural production value:
- France (€88.3 billion)
- Germany (€75.5 billion)
- Italy (€70.2 billion)
- Spain (€68.7 billion)
- Netherlands (€41.3 billion)
- Poland (€39.5 billion)
- Romania (€20.2 billion)
Performance Variations
Fifteen member states recorded an increase in the value of their agricultural production, while others saw significant declines. These trends highlight regional economic vulnerabilities and opportunities.
- States with notable increases: Ireland (+8.9%), Croatia (+8.8%), and Sweden (+5.0%), indicating positive economic momentum for their agricultural communities.
- States with significant decreases: France (-9.0%), Romania (-8.5%), and Bulgaria (-8.0%), signaling potential economic stress on farmers and rural areas, which could hinder progress on poverty reduction and economic stability goals.
Analysis of the Article in Relation to Sustainable Development Goals
1. Which SDGs are addressed or connected to the issues highlighted in the article?
-
SDG 2: Zero Hunger
- The article’s entire focus is on agricultural production, which is the foundation for achieving food security and ending hunger. It provides detailed statistics on the value (€531.9 billion), volume, and composition (crops vs. animal products) of agricultural output in the EU, all of which are central to the availability of food.
-
SDG 8: Decent Work and Economic Growth
- The article directly addresses the economic performance of the agricultural sector. It quantifies the sector’s economic contribution by reporting the “gross value added generated by agriculture, reaching 228.6 billion euros.” This figure is a direct measure of the sector’s role in the overall economic growth of the European Union.
-
SDG 12: Responsible Consumption and Production
- The article touches upon the production side of this goal by mentioning the “costs of agricultural inputs in the EU… (intermediate consumption).” Monitoring the value and changes in inputs (€303.3 billion, a 3.7% decrease) is a key first step in assessing the efficiency and sustainability of production patterns and resource use in agriculture.
2. What specific targets under those SDGs can be identified based on the article’s content?
-
Target 2.3: Double the agricultural productivity and incomes of food producers
- While the article does not specify small-scale producers, it provides macro-level data relevant to this target. The report on the “gross value added generated by agriculture” increasing by 3.1% is a direct measure of the income generated by the agricultural sector as a whole, reflecting on the financial well-being of food producers.
-
Target 8.1: Sustain per capita economic growth
- The article’s data on the “gross value added” of agriculture (€228.6 billion) is a component of the Gross Domestic Product (GDP). By tracking this value, the article provides insight into the agricultural sector’s contribution to the overall economic growth of the EU member states.
-
Target 12.2: Achieve the sustainable management and efficient use of natural resources
- The article’s mention of a 3.7% decrease in the “costs of agricultural inputs… (intermediate consumption)” relates to this target. While not a direct measure of physical resource use, monitoring the economic value of inputs is a proxy for understanding resource efficiency in the production process. A reduction in input costs can imply more efficient use or a shift in production methods.
3. Are there any indicators mentioned or implied in the article that can be used to measure progress towards the identified targets?
-
Value of Agricultural Production
- The article provides the total “value of agricultural production in the European Union (EU) was 531.9 billion euros.” This serves as a primary indicator for the economic output of the agricultural sector, relevant to SDG 2 and SDG 8.
-
Gross Value Added (GVA) by Agriculture
- The figure for “gross value added generated by agriculture, reaching 228.6 billion euros,” is a specific economic indicator. It measures the sector’s net contribution to the economy and is a direct way to track progress towards Target 2.3 (incomes) and Target 8.1 (economic growth).
-
Value of Intermediate Consumption (Agricultural Inputs)
- The reported “costs of agricultural inputs in the EU… (intermediate consumption) were 3.7% lower… amounting to 303.3 billion euros.” This financial metric is an implied indicator for Target 12.2, as it reflects the economic dimension of resource consumption in the agricultural production chain.
4. Summary Table of SDGs, Targets, and Indicators
| SDGs | Targets | Indicators Identified in the Article |
|---|---|---|
| SDG 2: Zero Hunger | Target 2.3: Double the agricultural productivity and incomes of food producers. | Gross value added generated by agriculture (€228.6 billion). |
| SDG 8: Decent Work and Economic Growth | Target 8.1: Sustain per capita economic growth. | Gross value added generated by agriculture as a contribution to the economy. |
| SDG 12: Responsible Consumption and Production | Target 12.2: Achieve the sustainable management and efficient use of natural resources. | Costs of agricultural inputs / intermediate consumption (€303.3 billion). |
Source: europeannewsroom.com
What is Your Reaction?
 Like
0
 Dislike
0
 Love
0
 Funny
0
 Angry
0
 Sad
0
Sad
0
 Wow
0
Wow
0


