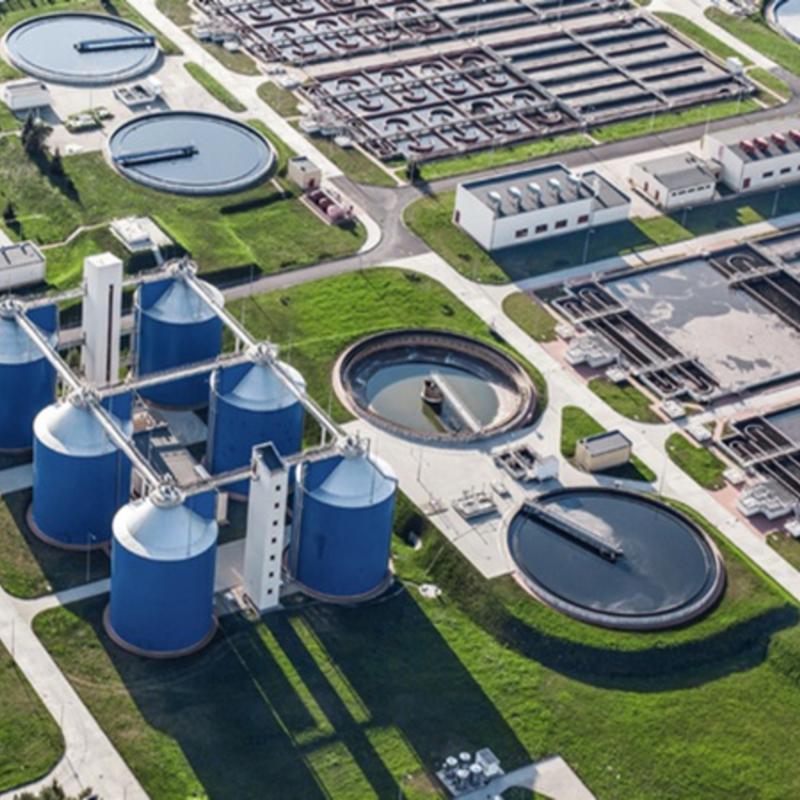
Biological Wastewater Treatment Market | Global Market Analysis Report – 2035 – Fact.MR

Report on the Global Biological Wastewater Treatment Market: Forecast and Sustainable Development Outlook 2025-2035
The global biological wastewater treatment market is projected to expand from a value of USD 10.8 billion in 2025 to USD 19.5 billion by 2035, demonstrating a Compound Annual Growth Rate (CAGR) of 6.1%. This growth is fundamentally linked to the global pursuit of the United Nations Sustainable Development Goals (SDGs), particularly SDG 6 (Clean Water and Sanitation), SDG 11 (Sustainable Cities and Communities), and SDG 12 (Responsible Consumption and Production). Increasing urbanization, rising volumes of municipal and industrial wastewater, and stringent environmental regulations are compelling governments and industries to adopt sustainable water management practices. Biological treatment systems are central to this transition, offering efficient solutions for reducing organic loads and removing pathogens, thereby directly contributing to SDG 6.3, which aims to halve the proportion of untreated wastewater.
Market Projections and Key Indicators
- Market Value (2025): USD 10.8 billion
- Market Forecast Value (2035): USD 19.5 billion
- Forecast CAGR (2025-2035): 6.1%
- Dominant Process: Aerobic Treatment
- Key Growth Regions: Asia Pacific, North America, Europe
- Leading Market Players: Veolia Environment SA, Xylem Inc., Aquatech International, Ecolab Inc., Pentair plc
Contribution to Sustainable Development Goals (SDGs)
The expansion of the biological wastewater treatment market is a critical enabler for achieving several interconnected SDGs. The technology’s role extends beyond basic sanitation to encompass environmental protection, resource recovery, and sustainable industrialization.
SDG 6: Clean Water and Sanitation
The market’s primary function directly supports SDG Target 6.2 (achieve access to adequate and equitable sanitation) and Target 6.3 (improve water quality by reducing pollution and minimizing release of hazardous chemicals). By treating municipal and industrial effluents, these systems reduce waterborne diseases and protect aquatic ecosystems.
SDG 11: Sustainable Cities and Communities
As urban populations grow, managing wastewater becomes crucial for urban sustainability. Biological treatment facilities are essential infrastructure for achieving SDG Target 11.6 (reduce the adverse per capita environmental impact of cities), helping to create healthier and more resilient urban environments.
SDG 9 & 12: Sustainable Industry and Production
For industrial applications, biological treatment aligns with SDG 9.4 (upgrade infrastructure and retrofit industries to make them sustainable) and SDG 12.4 (achieve the environmentally sound management of wastes). The recovery of biogas from anaerobic digestion processes also contributes to SDG 7 (Affordable and Clean Energy) and SDG 13 (Climate Action) by creating renewable energy and reducing methane emissions.
Segmental Analysis
Process Segment: Aerobic Systems Lead in Regulatory Compliance
The aerobic process segment is projected to hold a dominant market share of approximately 50.8% in 2025. Its leadership is attributed to high treatment efficiency and reliability in meeting stringent effluent quality standards, which is critical for municipal and industrial entities striving to comply with regulations aligned with SDG 6.3.
- Anaerobic Segment: Holding a 32.1% share, this segment is vital for high-strength industrial wastewater. Its ability to generate biogas supports circular economy principles and contributes to SDG 7 and SDG 12.
- Anoxic Segment: Accounting for 17.1%, this process is specialized for nutrient removal (denitrification), further enhancing water quality and protecting sensitive ecosystems.
End-Use Segment: Municipal Sector Drives SDG 6 Progress
The municipal segment is the largest end-user, accounting for 55.0% of the market share in 2025. This dominance reflects the global effort to expand sanitation infrastructure to support growing urban populations, a core objective of SDG 6 and SDG 11. The industrial sector, representing 45.0% of the market, is driven by the need for regulatory compliance and the adoption of sustainable manufacturing practices under SDG 9.
Market Dynamics: Drivers, Restraints, and Key Trends
Key Drivers Aligned with Global Sustainability Mandates
- Stringent Environmental Regulations: Government policies aimed at pollution control and water conservation are the primary market driver, directly enforcing the objectives of SDG 6.3.
- Rapid Urbanization and Industrial Growth: The expansion of cities and industries increases wastewater generation, necessitating scalable treatment solutions to meet the goals of SDG 9 and SDG 11.
- Focus on Circular Economy and Resource Recovery: A growing trend towards water reuse and energy recovery from waste is advancing the adoption of technologies like anaerobic digestion, supporting SDG 7 and SDG 12.
Market Restraints and Challenges
- High Capital Investment: The significant initial cost of advanced treatment infrastructure can be a barrier for smaller municipalities and industries, particularly in developing regions, potentially slowing progress towards the SDGs.
- Technical Complexity: The operation and optimization of biological processes require skilled personnel, posing a challenge for regions with limited technical capacity.
Regional Analysis and Progress Towards SDGs
Different regions are adopting biological wastewater treatment technologies at varying rates, largely influenced by national development priorities, regulatory enforcement, and infrastructure investment programs tied to their SDG commitments.
Country-Level Growth Projections (CAGR 2025-2035)
- India: 7.9%
- China: 7.0%
- Brazil: 6.5%
- Saudi Arabia: 6.0%
- USA: 5.8%
- UK: 5.2%
- Germany: 4.9%
Asia Pacific: Leading Global Growth in Pursuit of SDG 6
India (7.9% CAGR) and China (7.0% CAGR) are leading market expansion. This growth is propelled by national initiatives like the Clean India Mission and China’s stringent pollution control policies, which are directly aimed at achieving SDG 6 and SDG 11 by addressing severe water pollution and expanding sanitation coverage.
North America and Europe: Modernizing Infrastructure for Enhanced Sustainability
The USA (5.8% CAGR), Germany (4.9% CAGR), and the UK (5.2% CAGR) are focused on upgrading aging infrastructure to comply with evolving environmental standards. This includes adopting advanced nutrient removal and energy-efficient technologies, contributing to the circular economy and reinforcing their commitment to SDG 9 and SDG 12.
Other Key Regions
Brazil’s growth (6.5% CAGR) is linked to industrial expansion and stricter environmental enforcement, while Saudi Arabia’s focus (6.0% CAGR) is on water security and reuse, a critical strategy for achieving SDG 6 in water-scarce regions.
Competitive Landscape and Stakeholder Contributions to the SDGs
The market is moderately concentrated, with leading players like Veolia Environment SA, Xylem Inc., and Aquatech International leveraging comprehensive technology portfolios to support global sustainability efforts. Competition is centered on efficiency, reliability, and the ability to integrate resource recovery into treatment processes.
Framework for Stakeholder Contributions
Achieving the full potential of biological wastewater treatment requires coordinated action from all stakeholders to accelerate progress on the SDGs.
Role of Governments
- Infrastructure Investment: Prioritize and fund wastewater treatment infrastructure to meet national targets for SDG 6 and SDG 11.
- Regulatory Frameworks: Enforce stringent discharge standards that encourage the adoption of effective treatment technologies.
- Incentives: Provide financial incentives for industries that invest in advanced, sustainable water treatment systems.
Role of Industry Bodies
- Performance Standards: Establish clear performance benchmarks and certification programs to ensure technology effectiveness and reliability.
- Best Practices: Promote knowledge sharing and best practices for sustainable wastewater management and resource recovery.
Role of Technology Providers and Engineering Firms
- Innovation: Develop next-generation treatment systems that are more efficient, cost-effective, and easier to operate, particularly for decentralized applications.
- Integrated Solutions: Offer comprehensive services from design to operational support to ensure long-term performance and sustainability.
Analysis of Sustainable Development Goals in the Article
1. Which SDGs are addressed or connected to the issues highlighted in the article?
-
SDG 6: Clean Water and Sanitation
This is the most central SDG, as the entire article focuses on biological wastewater treatment. The text discusses the necessity of treating municipal and industrial wastewater to manage water quality, prevent pollution, and enable water reuse, which are core components of SDG 6.
-
SDG 9: Industry, Innovation, and Infrastructure
The article highlights the role of technological innovation and infrastructure upgrades in the wastewater treatment sector. It details advancements like membrane bioreactors (MBR) and integrated fixed-film activated sludge (IFAS), and emphasizes the modernization of “ageing infrastructure” to create more efficient and sustainable industrial and municipal systems.
-
SDG 11: Sustainable Cities and Communities
The growth of the wastewater treatment market is directly linked to “urban population expansion” and “rapid urbanization.” The article underscores the critical role of municipal wastewater treatment plants in managing urban sanitation and reducing the environmental impact of cities.
-
SDG 12: Responsible Consumption and Production
The article discusses the shift towards a circular economy through “wastewater recycling,” “resource recovery from wastewater,” and “biogas recovery.” These practices align with the goal of sustainable management of resources and waste reduction.
-
SDG 14: Life Below Water
By focusing on treating wastewater before it is discharged, the article addresses the prevention of pollution from land-based activities. It specifically mentions the need to meet “tightening limits on nitrogen and phosphorus discharge,” which are major pollutants affecting marine and freshwater ecosystems.
2. What specific targets under those SDGs can be identified based on the article’s content?
-
Target 6.3: Improve water quality by reducing pollution and increasing wastewater treatment and reuse.
The article directly supports this target by describing the market growth for technologies that treat wastewater from municipal and industrial sources. It highlights processes that achieve “efficient organic load reduction, biodegradation, and pathogen removal” and emphasizes the “rising emphasis on wastewater recycling for non-potable purposes.”
-
Target 9.4: Upgrade infrastructure and retrofit industries for sustainability.
This target is addressed through the article’s focus on replacing “traditional systems with upgraded biological technologies” and modernizing “ageing facilities.” The discussion on deploying anaerobic digestion to enable “biogas recovery and operational cost reduction” in industries is a clear example of retrofitting for sustainability and resource efficiency.
-
Target 11.6: Reduce the adverse per capita environmental impact of cities, including waste management.
The article connects to this target by identifying “rising municipal wastewater volumes” due to urbanization as a key market driver. The expansion of municipal sewage treatment plants, which account for “55.0% of the market share,” is a direct effort to manage city-generated waste and protect the urban environment.
-
Target 12.5: Substantially reduce waste generation through prevention, reduction, recycling and reuse.
The article’s mention of a “growing emphasis on circular economy principles and resource recovery from wastewater” aligns with this target. Specific examples include converting waste into usable energy (biogas) and recycling treated wastewater for “landscaping, industrial cooling, and groundwater recharge.”
-
Target 14.1: Prevent and significantly reduce marine pollution from land-based activities, including nutrient pollution.
This target is supported by the article’s discussion of “increasingly strict environmental regulations governing effluent discharge, nutrient loading.” The adoption of technologies for “biological nutrient removal (BNR)” is a specific action to meet “tightening limits on nitrogen and phosphorus discharge,” thereby reducing nutrient pollution from land.
3. Are there any indicators mentioned or implied in the article that can be used to measure progress towards the identified targets?
-
Indicators for Target 6.3:
- Treatment Efficiency: The article states that “biological treatment processes typically providing 85-95% organic pollutant removal rates,” which serves as a direct measure of treatment effectiveness.
- Investment in Treatment: The market’s projected growth from “USD 10.8 billion in 2025” to “USD 19.5 billion by 2035” indicates an increasing financial commitment to wastewater treatment.
- Water Reuse Application: The mention of treated wastewater being used for “landscaping, industrial cooling, and groundwater recharge” implies an increase in the volume of safely reused water.
-
Indicators for Target 9.4:
- Adoption of Advanced Technology: The article implies progress by tracking the adoption of specific technologies like “membrane bioreactors (MBR)” and “anaerobic digestion.”
- Energy Recovery: The ability to enable “biogas recovery” and “methane production” is a measurable outcome of sustainable industrial retrofitting.
-
Indicators for Target 11.6:
- Municipal Treatment Capacity: The article notes that “municipal wastewater treatment capacity requirements expanding by 15-20% annually in high-growth emerging economies,” which is a clear indicator of progress in managing urban waste.
- Proportion of Municipal Treatment: The fact that the “municipal segment” constitutes “55.0% of the market share” can be used to track the focus on urban wastewater management.
-
Indicators for Target 14.1:
- Regulatory Compliance Rate: The article provides a specific metric for the UK, which has achieved “98% compliance rates across municipal treatment facilities,” serving as a direct indicator of pollution control.
- Nutrient Removal: The implementation of “biological nutrient removal (BNR)” systems to reduce nitrogen and phosphorus is an implied indicator of efforts to curb nutrient pollution.
4. SDGs, Targets, and Indicators Summary
| SDGs | Targets | Indicators |
|---|---|---|
| SDG 6: Clean Water and Sanitation | Target 6.3: Improve water quality by reducing pollution, halving the proportion of untreated wastewater, and increasing recycling and safe reuse. |
|
| SDG 9: Industry, Innovation, and Infrastructure | Target 9.4: Upgrade infrastructure and retrofit industries to make them sustainable and increase resource-use efficiency. |
|
| SDG 11: Sustainable Cities and Communities | Target 11.6: Reduce the adverse per capita environmental impact of cities, including municipal waste management. |
|
| SDG 12: Responsible Consumption and Production | Target 12.5: Substantially reduce waste generation through recycling and reuse. |
|
| SDG 14: Life Below Water | Target 14.1: Prevent and significantly reduce marine pollution from land-based activities, including nutrient pollution. |
|
Source: factmr.com
What is Your Reaction?
 Like
0
 Dislike
0
 Love
0
 Funny
0
 Angry
0
 Sad
0
Sad
0
 Wow
0
Wow
0


