


;Resize=620#)


K-12 Education Spending Spotlight 2025: Annual public school spending nears $1 trillion – Reason Foundation
Report on K-12 Public Education Trends and Alignment with Sustainable Development Goals
This report analyzes key trends in United States K-12 public education, examining financial allocations, resource management, educator welfare, and academic performance. The findings are contextualized within the framework of the United Nations Sustainable Development Goals (SDGs), primarily focusing on SDG 4 (Quality Education), with additional considerations for SDG 8 (Decent Work and Economic Growth), SDG 10 (Reduced Inequalities), and SDG 16 (Peace, Justice, and Strong Institutions).
Financial Commitment and Resource Allocation for SDG 4
Trends in Per-Student and Total Funding
Significant financial resources are being allocated to the U.S. public education system, a critical input for achieving SDG 4. However, the distribution and impact of these funds require careful examination.
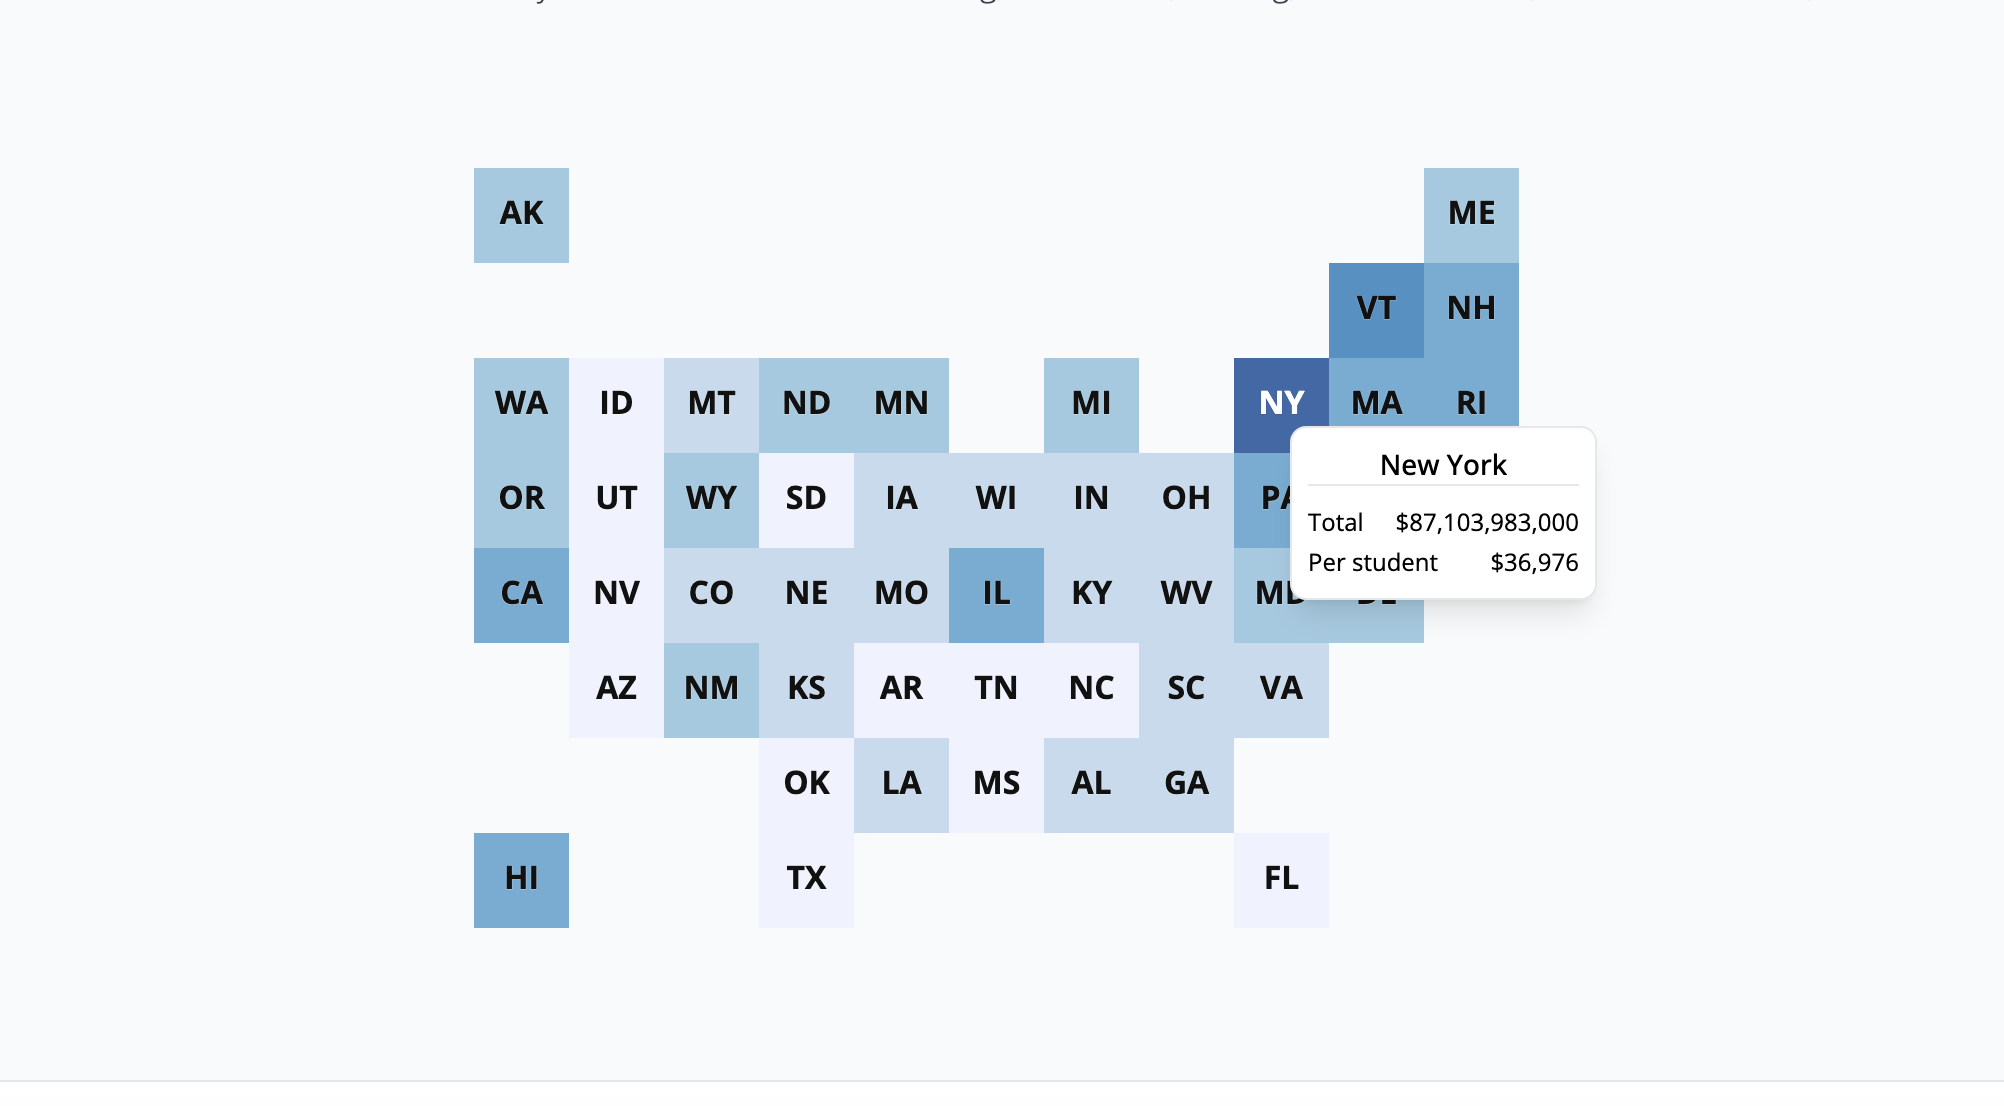
- Total nationwide public school funding approached $946.5 billion in 2023.
- Inflation-adjusted per-student funding increased by 35.8% between 2002 and 2023, rising from $14,969 to $20,322.
- Eight states exceeded $25,000 in per-student spending in 2023, with New York leading at $36,976.
- Post-pandemic, national K-12 funding increased by 8.6% ($1,610 per student) between 2020 and 2023, largely due to federal COVID-19 relief funds.
Policy Implications for Sustainable Educational Financing
The expiration of federal pandemic relief funding presents a challenge to the sustainability of current spending levels. To ensure continued progress toward SDG 4, policymakers must focus on maximizing the efficiency and impact of existing state and local financial resources, particularly in an environment of economic uncertainty and declining student enrollment.
Institutional Efficiency and Resource Management (SDG 16)
Allocation Toward Employee Benefits and Pension Liabilities
The allocation of educational funding raises concerns about institutional efficiency, a key component of SDG 16. A growing portion of funds is being diverted from direct instructional purposes.
- Inflation-adjusted spending on employee benefits grew by 81.1% between 2002 and 2023, from $2,221 to $4,022 per student.
- In contrast, spending on employee salaries grew by only 7.7% in the same period.
- For every new dollar spent on salaries, benefit expenditures rose by $3.27.
- Rising teacher pension debt is a primary driver of this trend, diverting funds that could otherwise support classroom instruction and progress toward SDG 4.
Staffing Levels Relative to Student Enrollment
An analysis of staffing trends reveals a misalignment between human resources and student populations, questioning the efficient use of funds to achieve quality education.
- Between 2002 and 2023, public school staff increased by 15.1%, while student enrollment grew by only 4.1%.
- The growth was concentrated in non-teaching staff, which increased by 22.8%, while the number of teachers rose by 7.6%.
- Despite a drop of 1.18 million students between 2020 and 2023, public schools added over 81,000 non-teaching staff members.
This trend indicates an unsustainable model that may hinder the effective allocation of resources needed to achieve the learning outcomes specified in SDG 4.1.
Educator Compensation and Decent Work (SDG 4.c & SDG 8)
Analysis of Teacher Salary Trends
Achieving SDG 4.c, which aims to increase the supply of qualified teachers, is intrinsically linked to providing decent work and fair compensation as outlined in SDG 8. Current salary trends present a significant challenge to this goal.
- The national average inflation-adjusted teacher salary declined by 6.1% between 2002 and 2022, from $75,152 to $70,548.
- A significant portion of this decline occurred post-pandemic, with a 5.6% drop between 2020 and 2022.
- In the 2020-2022 period, average teacher salaries decreased in all states except one.
Stagnant or declining real wages, driven by inflation and rising benefit costs, threaten the recruitment and retention of a qualified teaching workforce, thereby jeopardizing the quality of education.
Assessment of Learning Outcomes and Equity (SDG 4.1 & SDG 10)
National Assessment of Educational Progress (NAEP) Results
The ultimate measure of success for SDG 4 is the achievement of relevant and effective learning outcomes (Target 4.1). Despite record funding levels, student performance indicates a regression.
- The percentage of students scoring below the “Basic” level on NAEP assessments in 4th and 8th-grade math and reading was higher in 2024 than in 2003.
- Student performance generally improved between 2003 and 2013 but began to decline even before the COVID-19 pandemic.
- The pandemic sharply accelerated this decline, and recovery has been insufficient, with scores in most subjects regressing further between 2022 and 2024.
Outcomes for Low-Income Students
The data reveals significant challenges to achieving the goals of equitable education (SDG 4) and reduced inequalities (SDG 10).
- Low-income students exhibit a similar trend of performance decline, with dramatic drops post-pandemic.
- By 2024, performance for low-income 8th graders in both math and reading was worse than in 2003.
This disconnect between increased financial inputs and declining, inequitable learning outcomes suggests that current strategies are insufficient to meet the targets of SDG 4.1.
Conclusion and Policy Recommendations for Advancing SDGs
The analysis reveals a critical divergence between rising educational expenditures and declining student outcomes and teacher welfare. To realign with the objectives of SDG 4, policymakers must address systemic challenges.
- Enhance Institutional Effectiveness (SDG 16): Shift focus from increasing funding to maximizing the impact of existing resources. Address structural costs, such as unfunded pension liabilities, to redirect funds toward direct educational services.
- Promote Decent Work for Educators (SDG 4.c & SDG 8): Implement reforms that ensure increased educational funding translates into competitive teacher salaries, which is essential for attracting and retaining a high-quality teaching workforce.
- Ensure Efficient Resource Use: Re-evaluate staffing models to align with declining student enrollment and ensure that personnel resources are optimized to support the core mission of student learning.
- Focus on Equitable Learning Outcomes (SDG 4.1 & SDG 10): Prioritize evidence-based interventions that directly address learning gaps and improve academic proficiency, particularly for disadvantaged student populations, to make tangible progress toward providing quality, equitable education for all.
Analysis of Sustainable Development Goals in the Article
1. Which SDGs are addressed or connected to the issues highlighted in the article?
-
SDG 4: Quality Education
This is the most central SDG addressed. The article extensively discusses the quality and outcomes of the U.S. public education system, focusing on student performance, funding, teacher salaries, and staffing—all critical components of a quality education system.
-
SDG 8: Decent Work and Economic Growth
The article’s detailed analysis of teacher salaries, which have declined significantly after adjusting for inflation, directly relates to the goal of ensuring decent work. The financial well-being of teachers is a key aspect of this SDG, as stagnant or falling real wages impact their economic security and the attractiveness of the profession.
-
SDG 10: Reduced Inequalities
The article touches upon inequality by analyzing the academic performance of low-income students. It notes that while their performance improved between 2003 and 2013, it worsened before the pandemic and dropped dramatically afterward, highlighting disparities in educational outcomes based on economic status.
2. What specific targets under those SDGs can be identified based on the article’s content?
-
Target 4.1: Ensure that all girls and boys complete free, equitable and quality primary and secondary education leading to relevant and effective learning outcomes.
The article directly addresses this target by focusing on “effective learning outcomes.” It presents data from the National Assessment of Educational Progress (NAEP), showing a decline in student proficiency in math and reading. The text states, “student outcomes were falling even before the COVID-19 pandemic, despite record funding levels,” indicating a failure to achieve quality learning outcomes.
-
Target 4.c: Substantially increase the supply of qualified teachers.
While not about increasing the number of teachers (the article notes staffing has increased), this target’s spirit involves creating conditions to retain a qualified teaching workforce. The article highlights systemic issues that undermine this, such as the finding that “the average teacher salary has declined significantly since the onset of the COVID-19 pandemic.” Falling real wages and rising benefit costs at the expense of salaries threaten the ability to attract and retain qualified teachers.
-
Target 8.5: Achieve full and productive employment and decent work for all… and equal pay for work of equal value.
This target is relevant to the discussion on teacher compensation. The article provides evidence that the work of teachers is not being adequately valued in monetary terms, stating that “the average inflation-adjusted teacher salary fell from $75,152 in 2002 to $70,548 in 2022… a 6.1% decline.” This failure to keep pace with inflation points to a lack of “decent work” for a critical professional group.
-
Target 10.4: Adopt policies, especially fiscal, wage and social protection policies, and progressively achieve greater equality.
The article is a critique of existing fiscal and wage policies in education. It analyzes how increased K-12 funding is allocated, noting that “public school funding is increasingly spent on employee benefits, including teacher pensions” rather than on teacher salaries or direct classroom investment. Furthermore, it presents data showing that “low-income 8th graders fared worse than they did in 2003,” indicating that current policies are not effectively reducing educational inequality.
3. Are there any indicators mentioned or implied in the article that can be used to measure progress towards the identified targets?
- Indicator for Target 4.1 (Learning Outcomes): The article explicitly uses the “share of students who perform below the basic performance threshold” on the National Assessment of Educational Progress (NAEP) tests for 4th and 8th-grade math and reading. It provides specific data, such as “outcomes in all four subjects were worse in 2024 than in 2003,” which serves as a direct measure of learning proficiency.
- Indicator for Target 4.c (Supply of Qualified Teachers): The “average inflation-adjusted teacher salary” is a key indicator mentioned. The article reports a 6.1% decline between 2002 and 2022. This metric can be used as a proxy to measure the financial attractiveness and sustainability of the teaching profession, which is crucial for retaining qualified educators.
- Indicator for Target 8.5 (Decent Work): The primary indicator is the “average inflation-adjusted teacher salary.” The article’s finding that salaries dropped by 5.6% between 2020 and 2022 due to inflation directly measures the erosion of “decent pay” for teachers.
-
Indicator for Target 10.4 (Fiscal/Wage Policies and Inequality): The article provides several indicators:
- Per-student funding: “Nationwide, public school funding increased by 35.8% between 2002 and 2023, rising from $14,969 per student to $20,322 per student after adjusting for inflation.” This measures the fiscal input.
- Allocation of funds: The article measures the growth in spending on “employee benefits” (up 81.1%) versus “employee salaries” (up 7.7%), indicating how fiscal policy prioritizes spending.
- Outcomes for disadvantaged groups: The NAEP scores for “low-income students” are used as an indicator to measure the effectiveness of policies in achieving greater educational equality.
4. Table of SDGs, Targets, and Indicators
| SDGs | Targets | Indicators |
|---|---|---|
| SDG 4: Quality Education | 4.1: Ensure quality primary and secondary education leading to effective learning outcomes. | Percentage of students scoring below the “basic” proficiency level on the National Assessment of Educational Progress (NAEP) in 4th and 8th-grade math and reading. |
| 4.c: Substantially increase the supply of qualified teachers. | Average inflation-adjusted teacher salary. | |
| SDG 8: Decent Work and Economic Growth | 8.5: Achieve decent work for all and equal pay for work of equal value. | Average inflation-adjusted teacher salary, which declined by 6.1% from 2002 to 2022. |
| SDG 10: Reduced Inequalities | 10.4: Adopt fiscal, wage, and social protection policies to achieve greater equality. |
|
Source: reason.org
What is Your Reaction?
 Like
0
Like
0
 Dislike
0
Dislike
0
 Love
0
Love
0
 Funny
0
Funny
0
 Angry
0
Angry
0
 Sad
0
Sad
0
 Wow
0
Wow
0