


The world’s largest cities under climate change and their adaptive capacity to rising heat – Nature
Executive Summary
A global analysis of 1563 of the world’s largest cities reveals a critical threat to the achievement of the Sustainable Development Goals (SDGs), particularly SDG 11 (Sustainable Cities and Communities) and SDG 13 (Climate Action). By integrating climate projections, urban morphology, and economic data, this report quantifies future urban heat exposure and adaptive capacity. Projections indicate that the number of major cities exceeding a mean annual temperature (MAT) of 29°C—a critical threshold for human habitability—will increase from 17 (2011–2040) to 217 by the end of the century (2071–2100) under a high-emissions scenario (SSP5-8.5). This will expose up to 320 million urban residents to chronic heat stress, undermining SDG 3 (Good Health and Well-being). The analysis highlights significant regional disparities, with cities in Africa and South America facing high baseline heat and low economic capacity to adapt, creating a major challenge for SDG 10 (Reduced Inequalities). The report identifies morphology-specific adaptation measures, such as greening and the use of reflective materials, providing a framework for targeted interventions to build climate-resilient and sustainable urban futures.
Introduction: Urbanization, Climate Change, and the Sustainable Development Goals
The global population is increasingly urban, with over four billion people now residing in cities. This trend presents a significant challenge to achieving SDG 11 (Sustainable Cities and Communities), as urban areas amplify the impacts of climate change. Urban warming dynamics, driven by land-use patterns and impervious surfaces, intensify heat stress and strain essential infrastructure, directly impacting public health and economic productivity. This report assesses chronic heat exposure using Mean Annual Temperature (MAT) as a key indicator. A MAT exceeding 29°C is used as a benchmark for conditions that push cities beyond a historically safe “human climate niche,” threatening urban livability and progress towards SDG 3 (Good Health and Well-being) and SDG 8 (Decent Work and Economic Growth). This analysis provides a global-scale integration of climate projections, intra-urban morphology, and socioeconomic capacity to inform urban planning and climate adaptation strategies in line with SDG 13 (Climate Action).
Research Objectives
This report addresses the following key questions to guide policy towards achieving sustainable urban development:
- How will mean annual temperatures evolve in 1563 major cities under different climate scenarios (SSP1-2.6, SSP3-7.0, and SSP5-8.5), and how do these trends impact regional progress towards SDG 13?
- How will population change and urban morphology jointly shape exposure to critical heat thresholds, and which regions face the greatest threat to SDG 11 and SDG 3?
- What specific adaptation measures, informed by urban morphology (Local Climate Zones), can be prioritized to build resilience, and how does economic capacity affect their implementation, highlighting challenges for SDG 1 (No Poverty) and SDG 10 (Reduced Inequalities)?
Methodology: An Integrated Framework for Assessing Urban Climate Risk
To evaluate future urban heat risk, this study employs a multi-faceted framework combining high-resolution data sources within morphologically defined city boundaries. This approach ensures a consistent and comparable global analysis, providing a robust evidence base for policies aimed at achieving the SDGs.
- Climate Projections: High-resolution (1 km) downscaled MAT projections from the CHELSA dataset were utilized for three Shared Socioeconomic Pathways (SSPs): SSP1-2.6 (sustainability), SSP3-7.0 (regional rivalry), and SSP5-8.5 (fossil-fueled development). This allows for an assessment of urban climate futures under varying global mitigation efforts, central to SDG 13.
- Population and Economic Data: Downscaled gridded population projections corresponding to the SSPs were used to quantify the number of people exposed to heat stress. Gridded Gross Domestic Product (GDP) data served as a proxy for the adaptive capacity of cities, linking climate risk to economic vulnerability as addressed in SDG 1 and SDG 10.
- Urban Morphology: A global map of Local Climate Zones (LCZs) was used to characterize the physical structure of each city. LCZs classify urban and natural landscapes into distinct types (e.g., compact high-rise, open low-rise, vegetated spaces), allowing for a nuanced understanding of how urban form influences thermal conditions and informs targeted adaptation strategies for SDG 11.
By integrating these datasets, the analysis identifies cities projected to exceed the 29°C MAT threshold, quantifies the exposed populations, and links urban form to specific adaptation needs and the capacity to implement them.
Key Findings: Projected Urban Heat Exposure and Vulnerability
Escalating Heat Exposure and its Impact on SDG 11
The analysis projects a dramatic increase in the number of cities facing chronic and dangerous heat levels, posing a direct threat to the safety and sustainability of urban communities. Under the high-emissions SSP5-8.5 scenario:
- The number of cities with a MAT above 29°C is projected to rise from 17 in the 2011-2040 period to 217 by 2071-2100.
- This will expose an estimated 320 million people to conditions outside the human climate niche, severely compromising progress on SDG 3 (Good Health and Well-being) and SDG 11 (Sustainable Cities and Communities).
- The majority of the exposed population will be in Asia (270 million) and Africa (40 million), concentrating the risk in rapidly urbanizing regions.
Even under the most optimistic scenario (SSP1-2.6), over 59 million people are projected to live in cities exceeding the 29°C threshold by the end of the century, underscoring the locked-in nature of urban climate risk and the urgent need for adaptation.
Regional Disparities and Implications for SDG 10
The impacts of rising urban heat are not evenly distributed, exacerbating existing global inequalities and hindering the achievement of SDG 10 (Reduced Inequalities).
- European cities face the steepest relative warming, with a median MAT increase of over 4°C under SSP5-8.5, challenging infrastructure designed for milder climates.
- African and South American cities, despite smaller temperature increases (2.7°C to 3.2°C), face greater overall risk due to higher baseline temperatures that are already close to the habitability threshold.
- African cities are projected to experience the fastest population growth, compounding heat exposure. For example, Niamey is projected to see a 586% population increase by 2100 under SSP5-8.5.
This convergence of high heat exposure, rapid population growth, and limited economic resources in cities of the Global South creates a critical vulnerability hotspot that demands global attention and support.
The Role of Urban Morphology in Climate Resilience
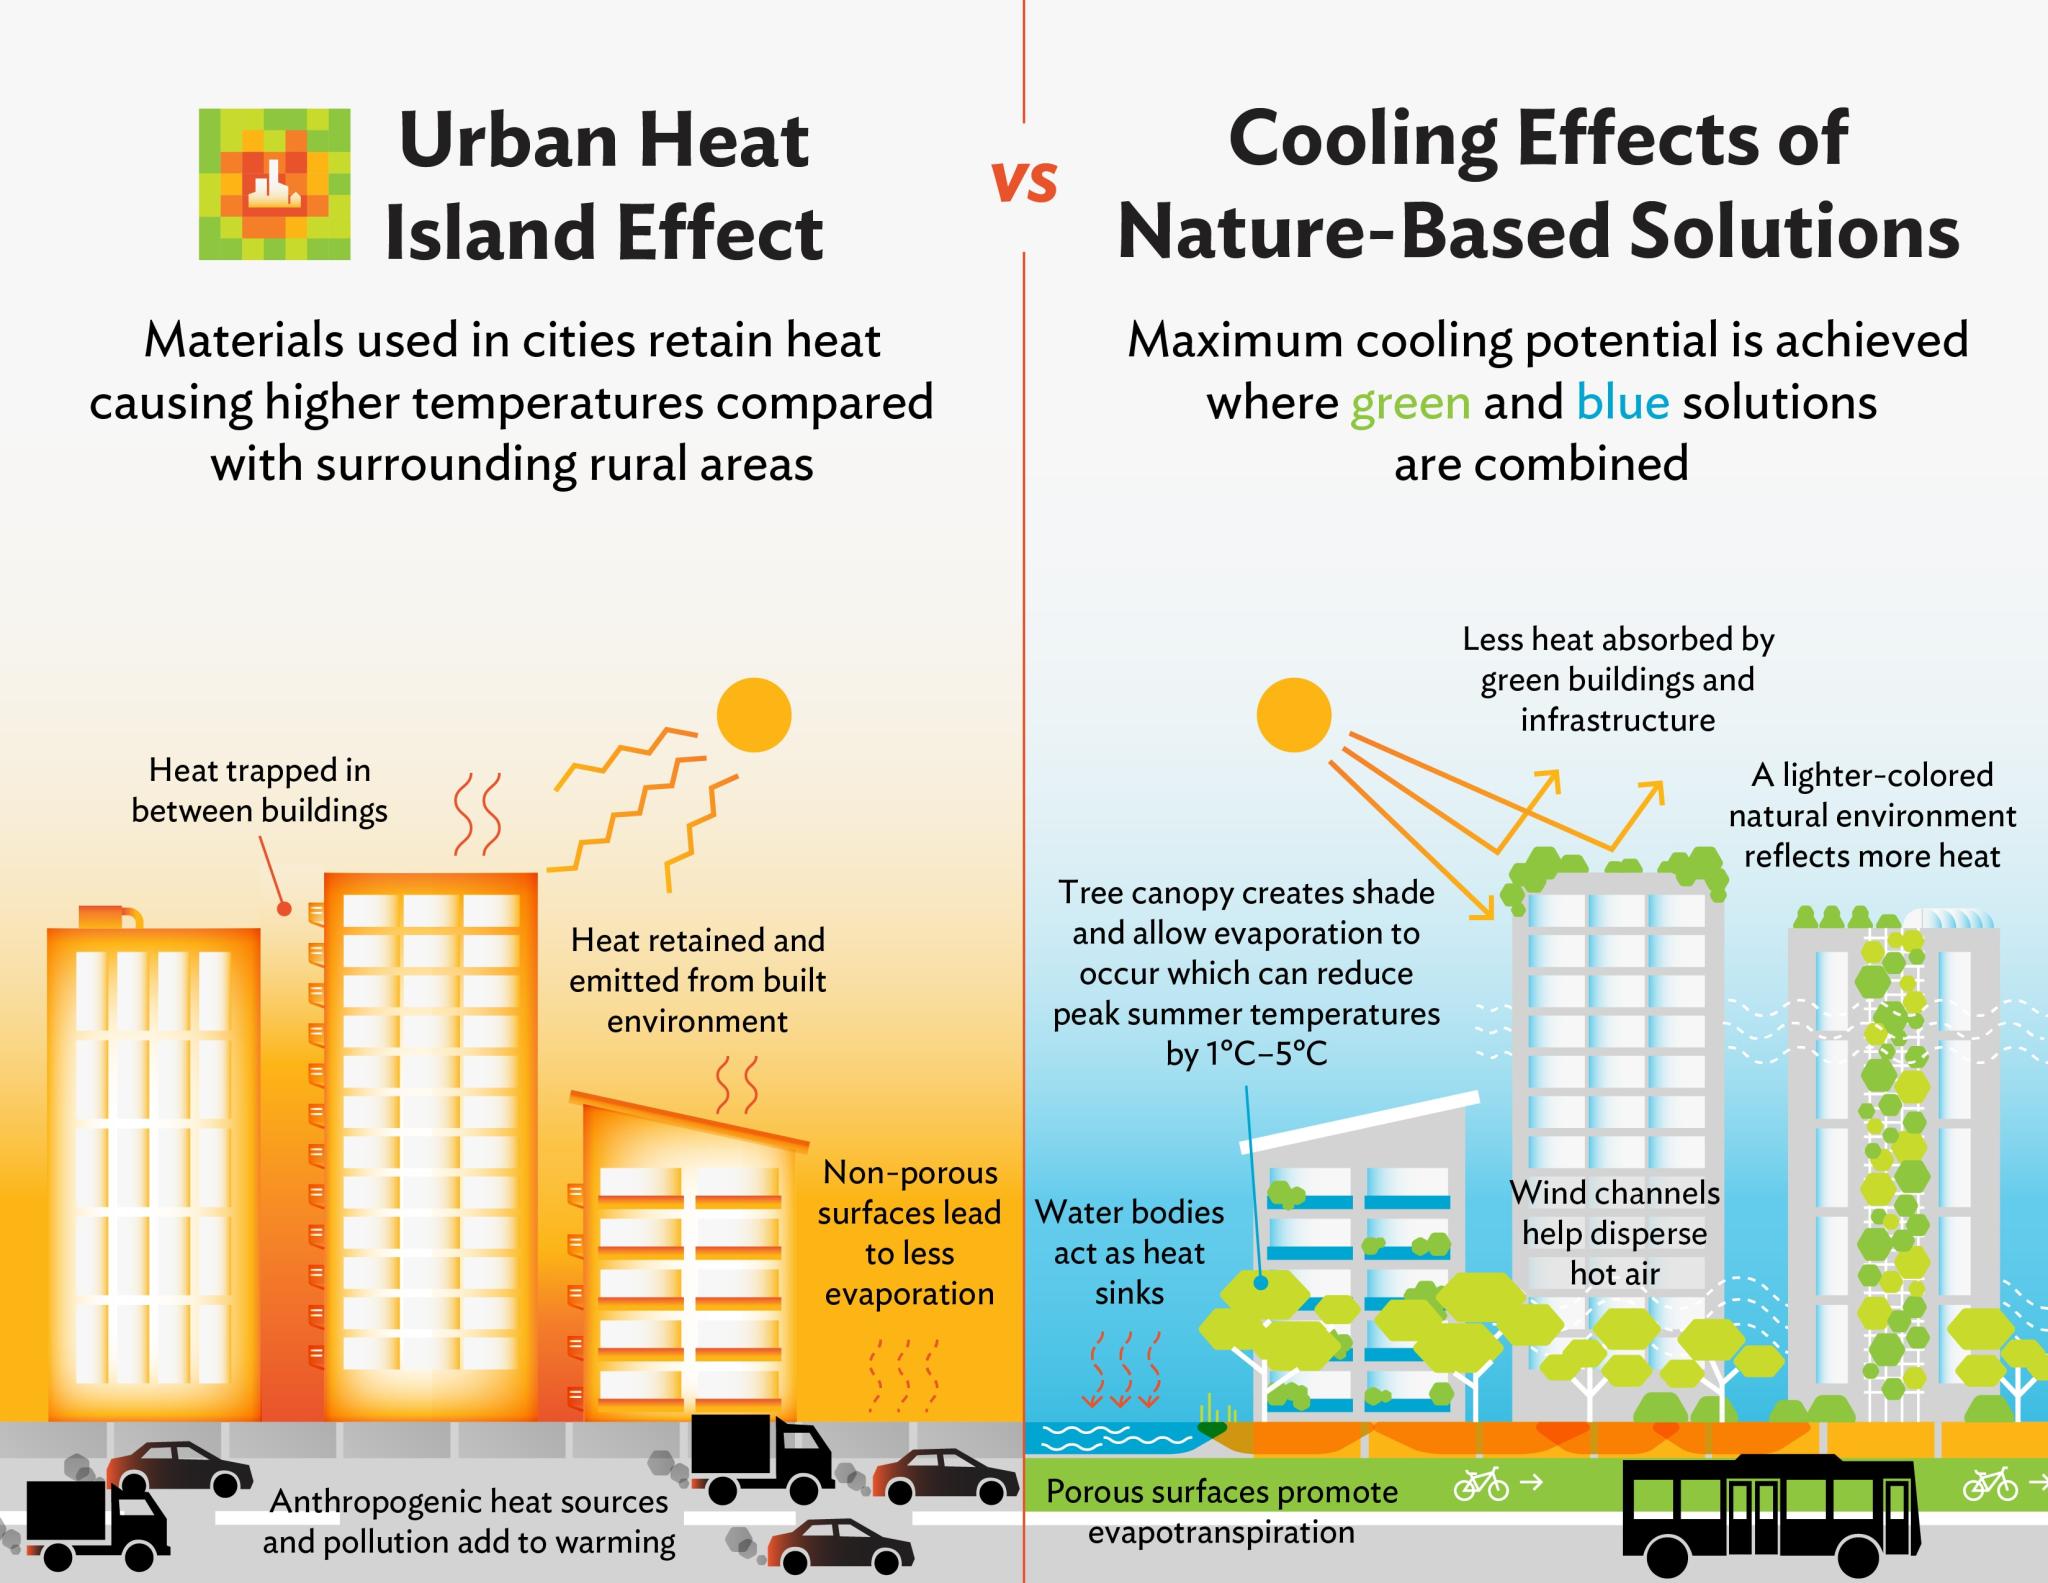
Urban form is a key determinant of local heat exposure. The analysis of LCZs reveals that cities projected to exceed the 29°C threshold share common morphological characteristics that amplify heat.
- Hotter cities exhibit a significantly higher proportion of bare natural surfaces and a lower share of green spaces (SDG 15 – Life on Land) and vegetation cover compared to cooler cities.
- This morphology, characterized by reduced evapotranspirative cooling and greater heat absorption, exacerbates thermal stress.
- These findings highlight that strategic urban planning focused on modifying urban form—such as increasing green infrastructure—is a powerful tool for building climate resilience and advancing SDG 11.
Adaptation Strategies and Capacity: A Pathway to Achieving SDG 13
Morphology-Informed Adaptation Measures
By linking LCZ profiles to an expert-based framework, the report identifies prioritized adaptation measures tailored to specific urban forms. This approach enables cities to develop targeted and effective heat action plans in line with SDG 13 (Climate Action). The highest-scoring interventions across all continents include:
- Increasing the pervious-surface fraction to reduce runoff and enhance cooling.
- Using reflective building materials (e.g., cool roofs) to reduce heat absorption in dense urban areas.
- Expanding greenspaces and vegetation cover to provide shade and evapotranspirative cooling.
- Enhancing urban water bodies for their cooling benefits and other co-benefits.
The relevance of each measure varies by local context. For example, increasing pervious surfaces is a high priority for arid cities like Kuwait City but less so for already green cities like Cherthala, India.
The Challenge of Adaptive Capacity: Linking SDG 1 and SDG 11
The ability to implement necessary adaptation measures is fundamentally linked to economic capacity, revealing a critical disconnect between need and resources. This gap poses a major barrier to achieving SDG 1 (No Poverty) and ensuring that climate adaptation is equitable.
- The analysis shows a stark contrast between regions. African cities, which face some of the highest MAT values, generally have the lowest GDP levels, constraining their ability to fund large-scale adaptation projects.
- In contrast, many European and North American cities have higher economic capacity but face less severe baseline heat (though significant warming).
- This disparity underscores that without international cooperation and financial support, the cities most vulnerable to extreme heat will be left behind, deepening global inequalities and failing the promise of the 2030 Agenda to “leave no one behind.”
Conclusion: A Call for Targeted Action to Build Resilient and Sustainable Cities
This report provides a comprehensive global assessment of future urban heat risk, demonstrating that climate change poses a severe threat to the livability and sustainability of cities worldwide. Without urgent and targeted action, hundreds of millions of urban dwellers, predominantly in Asia and Africa, will be exposed to dangerous levels of chronic heat, jeopardizing progress on key Sustainable Development Goals, including SDG 3 (Good Health and Well-being), SDG 10 (Reduced Inequalities), SDG 11 (Sustainable Cities and Communities), and SDG 13 (Climate Action).
The findings highlight that urban morphology is a critical lever for adaptation. By strategically planning for more green and pervious surfaces, and by deploying technologies like reflective materials, cities can significantly mitigate heat exposure. However, a profound gap exists between the need for adaptation and the economic capacity to implement it. To address this, an equity-focused approach is essential, requiring international cooperation, capacity building, and financial mechanisms to support the most vulnerable cities. By integrating high-resolution climate science with urban planning and socioeconomic analysis, this framework offers a practical roadmap for policymakers to build resilient, equitable, and sustainable cities for all.
Analysis of Sustainable Development Goals in the Article
1. Which SDGs are addressed or connected to the issues highlighted in the article?
The article on future urban heat exposure and adaptation capacity connects to several Sustainable Development Goals (SDGs) by addressing the interconnected challenges of climate change, urban development, health, and inequality.
-
SDG 3: Good Health and Well-being
The article directly relates to SDG 3 by focusing on the health impacts of rising urban temperatures. It discusses how increased heat stress puts a strain on public health systems and creates “baseline health risks.” The concept of a “human climate niche” and a “29 °C MAT threshold” is used to define conditions for “human habitability and well-being,” highlighting the threat that extreme heat poses to the physical and mental health of urban populations.
-
SDG 10: Reduced Inequalities
The analysis reveals significant inequalities in both exposure and the capacity to adapt to climate change. The article points out “large regional disparities in adaptive capacity,” noting that “African and South American cities” face high baseline heat but often have the “lowest GDP levels,” constraining their ability to implement adaptation measures. This highlights the disproportionate burden of climate change on less wealthy nations and vulnerable populations, such as those in informal settlements, which is a core concern of SDG 10.
-
SDG 11: Sustainable Cities and Communities
This is a central theme of the article. The entire study is framed around making cities more resilient and sustainable in the face of climate change. It analyzes “urban morphology,” “intra-urban land-cover heterogeneity,” and the impact of rising temperatures on “urban infrastructures.” The goal is to “safeguard urban habitability” by proposing targeted adaptation measures like greening and reflective materials, directly contributing to making cities inclusive, safe, resilient, and sustainable.
-
SDG 13: Climate Action
The article is fundamentally about climate action, specifically adaptation. It quantifies the future impacts of climate change on 1563 cities under different emission scenarios (SSP1-2.6, SSP5-8.5). By assessing “future urban heat exposure and adaptation capacity,” the research aims to inform and strengthen resilience. The proposed framework for “morphology- and economy-informed adaptation planning” provides a direct pathway for integrating climate change measures into urban policies and strategies.
2. What specific targets under those SDGs can be identified based on the article’s content?
Based on the issues discussed, several specific SDG targets can be identified:
-
SDG 3: Good Health and Well-being
- Target 3.d: Strengthen the capacity of all countries, in particular developing countries, for early warning, risk reduction and management of national and global health risks.
The article supports this target by identifying cities and populations at high risk of extreme heat, which is a significant global health risk. The framework provides a basis for developing early warning systems and risk reduction strategies tailored to specific urban morphologies.
- Target 3.d: Strengthen the capacity of all countries, in particular developing countries, for early warning, risk reduction and management of national and global health risks.
-
SDG 11: Sustainable Cities and Communities
- Target 11.5: By 2030, significantly reduce the number of deaths and the number of people affected and substantially decrease the direct economic losses relative to global gross domestic product caused by disasters, including water-related disasters, with a focus on protecting the poor and people in vulnerable situations.
The study directly addresses this by quantifying the “number of threshold-exceeding cities” and the “exposed populations” (up to 320 million residents) who will be affected by the climate-related disaster of extreme heat. - Target 11.b: By 2030, substantially increase the number of cities and human settlements adopting and implementing integrated policies and plans towards inclusion, resource efficiency, mitigation and adaptation to climate change, resilience to disasters, and develop and implement, in line with the Sendai Framework for Disaster Risk Reduction 2015–2030, holistic disaster risk management at all levels.
The article’s primary contribution is a framework for “morphology- and economy-informed adaptation planning.” It proposes specific, data-driven adaptation measures based on Local Climate Zone (LCZ) profiles, directly supporting the implementation of integrated plans for climate adaptation and resilience.
- Target 11.5: By 2030, significantly reduce the number of deaths and the number of people affected and substantially decrease the direct economic losses relative to global gross domestic product caused by disasters, including water-related disasters, with a focus on protecting the poor and people in vulnerable situations.
-
SDG 13: Climate Action
- Target 13.1: Strengthen resilience and adaptive capacity to climate-related hazards and natural disasters in all countries.
This is the core focus of the article. It explicitly assesses the “adaptive capacity” of cities using GDP as a proxy and links it to the level of exposure to heat. The entire analysis is designed to help cities strengthen their resilience to the hazard of rising temperatures. - Target 13.2: Integrate climate change measures into national policies, strategies and planning.
The research provides a scientific basis and a practical methodology for integrating climate adaptation into urban planning. By linking urban form (LCZ) to specific adaptation measures, it offers a roadmap for policymakers to create targeted and effective climate strategies.
- Target 13.1: Strengthen resilience and adaptive capacity to climate-related hazards and natural disasters in all countries.
3. Are there any indicators mentioned or implied in the article that can be used to measure progress towards the identified targets?
Yes, the article mentions and uses several quantitative and qualitative indicators that can measure progress towards the identified targets.
-
Indicators for Exposure and Risk (Targets 11.5, 13.1)
- Mean Annual Temperature (MAT): Used as a primary indicator of chronic heat exposure and stress on urban systems. Progress could be measured by tracking how adaptation measures affect local MAT or mitigate its impacts.
- Number of people exposed to MAT > 29°C: A direct metric for measuring the population affected by extreme heat. A reduction in this number through mitigation or successful adaptation would indicate progress. The article projects this number will rise to “320 million residents.”
- Number of cities exceeding the 29°C MAT threshold: This indicator measures the geographic scale of the climate hazard. The article projects this will rise from 17 to 217 cities.
-
Indicators for Adaptive Capacity and Action (Targets 11.b, 13.1)
- Gross Domestic Product (GDP) per city: Used as a proxy indicator for the financial capacity to implement adaptation measures. Tracking investment in adaptation relative to GDP could measure commitment.
- Local Climate Zone (LCZ) profiles: The share of different LCZs (e.g., green spaces, compact high-rise, open low-rise) serves as an indicator of urban morphology. Progress can be measured by changes in these profiles over time, such as an increase in the share of green spaces (LCZ A, B, C) or a reduction in bare natural surfaces (LCZ F).
- Scores for adaptation measures: The article calculates scores for interventions like “increasing the pervious-surface fraction,” “expanding greenspaces,” and using “reflective building materials.” These scores can be used as a baseline to track the implementation and prioritization of adaptation strategies in cities.
4. Table of SDGs, Targets, and Indicators
| SDGs | Targets | Indicators Identified in the Article |
|---|---|---|
| SDG 3: Good Health and Well-being | 3.d: Strengthen capacity for early warning, risk reduction, and management of health risks. |
|
| SDG 10: Reduced Inequalities | 10.2: Empower and promote the social, economic and political inclusion of all. |
|
| SDG 11: Sustainable Cities and Communities | 11.5: Reduce the number of people affected by disasters, with a focus on protecting the poor and vulnerable. |
|
| 11.b: Increase the number of cities adopting and implementing integrated policies and plans for adaptation to climate change and resilience. |
|
|
| SDG 13: Climate Action | 13.1: Strengthen resilience and adaptive capacity to climate-related hazards. |
|
| 13.2: Integrate climate change measures into policies, strategies and planning. |
|
Source: nature.com

What is Your Reaction?
 Like
0
Like
0
 Dislike
0
Dislike
0
 Love
0
Love
0
 Funny
0
Funny
0
 Angry
0
Angry
0
 Sad
0
Sad
0
 Wow
0
Wow
0