The Water Infrastructure Investments States Will Need – Governing

Report on United States Water Infrastructure Investment Needs and Sustainable Development Goal Alignment
Executive Summary
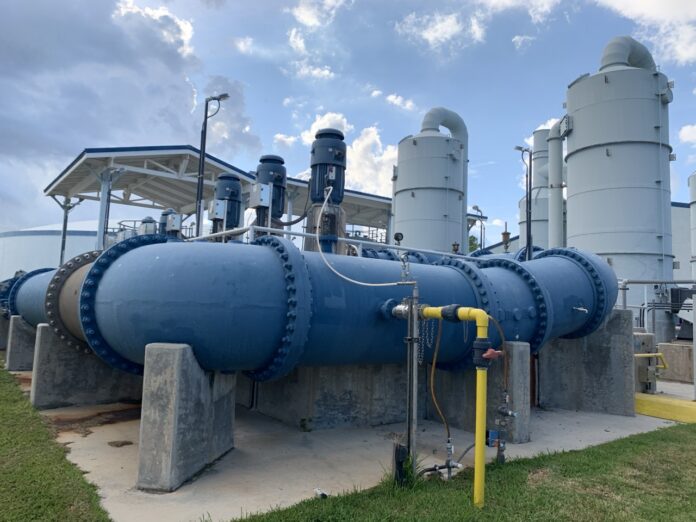
A comprehensive analysis reveals a critical investment deficit in the United States’ water infrastructure, posing a significant threat to the achievement of multiple Sustainable Development Goals (SDGs), most notably SDG 6 (Clean Water and Sanitation). A new report from the Value of Water Campaign indicates a required investment of $3.4 trillion over the next two decades to modernize drinking water, stormwater, and wastewater systems. This report outlines the scale of the funding gap, its socio-economic implications, and the direct correlation between infrastructure investment and progress towards the 2030 Agenda for Sustainable Development.
Analysis of the Infrastructure Deficit and SDG Impact
The Investment Gap and its Threat to SDG 6
The nation’s ability to provide universal access to clean water and sanitation is compromised by decades of underinvestment. The current funding landscape presents a direct challenge to meeting the targets of SDG 6.
- Total Estimated Need: $3.4 trillion over 20 years.
- Projected Funding Gap: $2 trillion, after accounting for state and local government contributions.
- Declining Federal Role: Federal capital investment has fallen from nearly 50% of the total in 1981 to just 7% by 2021, shifting the burden to local entities and jeopardizing equitable access.
Failure to close this gap will impede progress on Target 6.1 (achieve universal and equitable access to safe and affordable drinking water) and Target 6.3 (improve water quality by reducing pollution).
Infrastructure Condition and Relation to SDG 9 and SDG 11
The physical state of U.S. water systems, much of which dates to the 1970s and 1980s, is inadequate for building resilient and sustainable communities.
- Poor Assessment: The American Civil Society of Engineers assigned grades ranging from C- to D for the nation’s water infrastructure, indicating systemic vulnerabilities.
- Impact on SDG 9: This state of disrepair directly contravenes SDG 9 (Industry, Innovation, and Infrastructure), which calls for the development of quality, reliable, sustainable, and resilient infrastructure.
- Impact on SDG 11: Inadequate water and wastewater management undermines the goal of making cities and human settlements inclusive, safe, resilient, and sustainable (SDG 11).
The U.S. Environmental Protection Agency (EPA) estimates that $1.6 trillion is required for drinking water infrastructure alone, primarily for distribution and transmission systems.
State-Level Disparities and Funding Uncertainty
Geographic Distribution of Need
While populous states like California and Texas require the largest total investment, per capita needs are often greater in smaller states and rural areas. This disparity highlights a challenge to the SDG principle of “leaving no one behind,” as rural communities face a disproportionately larger infrastructure burden to ensure access to clean water (SDG 6).
Federal Funding Uncertainty
The Infrastructure Investment and Jobs Act (IIJA) provides approximately $8 billion annually through 2026. However, its reauthorization is uncertain. A failure to extend this funding would widen the investment gap and stall progress on critical projects, directly impacting the nation’s ability to advance on its SDG commitments.
Socio-Economic Implications and Broader SDG Connections
Economic Growth and Decent Work (SDG 8)
Investing in water infrastructure is a significant driver of economic growth and job creation, aligning with SDG 8 (Decent Work and Economic Growth). Economic modeling indicates substantial returns:
- Every $1 million invested is projected to create 10 jobs.
- Every $1 million invested generates an estimated $2.5 million in economic output and $1.4 million in GDP.
These investments support stable, well-paying jobs in construction, operations, and supply chains, contributing to sustainable economic development.
Affordability, Health, and Social Equity (SDG 1, SDG 3, SDG 10)
The operational funding gap, estimated at over $1 trillion for the next two decades, poses a threat to social equity.
- Impact on Poverty (SDG 1): If ratepayers bear the cost, the average household water and sewer bill could increase by $1,000 annually. This represents a more than 200% increase for low-income households, exacerbating poverty and inequality.
- Impact on Health (SDG 3): Reliable water infrastructure is fundamental to public health. Failing systems increase the risk of waterborne diseases, undermining SDG 3 (Good Health and Well-being).
- Impact on Inequality (SDG 10): The disproportionate financial burden on vulnerable populations widens the inequality gap, conflicting with the objectives of SDG 10 (Reduced Inequalities).
Analysis of Sustainable Development Goals in the Article
1. Which SDGs are addressed or connected to the issues highlighted in the article?
-
SDG 6: Clean Water and Sanitation
The article’s central theme is the critical need for investment in drinking water, stormwater, and wastewater infrastructure to ensure reliable and safe water services. This directly aligns with SDG 6, which aims to ensure the availability and sustainable management of water and sanitation for all.
-
SDG 9: Industry, Innovation and Infrastructure
The article focuses on the deterioration of essential public infrastructure (water systems) and the necessity of significant financial investment to upgrade and maintain it. This connects directly to SDG 9, which calls for building resilient infrastructure, promoting sustainable industrialization, and fostering innovation.
-
SDG 8: Decent Work and Economic Growth
The article explicitly quantifies the economic benefits of investing in water infrastructure, including job creation, increased GDP, and labor income. This relates to SDG 8, which promotes sustained, inclusive, and sustainable economic growth, full and productive employment, and decent work for all.
-
SDG 11: Sustainable Cities and Communities
Reliable water and sanitation systems are fundamental basic services for any community. The article discusses the infrastructure needs for both urban and rural areas, which is a core component of SDG 11’s goal to make cities and human settlements inclusive, safe, resilient, and sustainable.
2. What specific targets under those SDGs can be identified based on the article’s content?
-
SDG 6: Clean Water and Sanitation
- Target 6.1: “By 2030, achieve universal and equitable access to safe and affordable drinking water for all.” The article directly addresses this by stating that an estimated “$1.6 trillion to upgrade drinking water infrastructure alone” is needed to bring systems up to date and ensure they can reliably deliver water to homes and industries.
- Target 6.a: “By 2030, expand international cooperation and capacity-building support…in water- and sanitation-related activities…” While the article focuses on the U.S., it highlights the critical role of financial resources and investment, a key principle of this target. It points out the decline in federal funding from “almost half of the total for the year” in 1981 to just “7 percent of total funding” by 2021, emphasizing the need to mobilize financial support.
-
SDG 9: Industry, Innovation and Infrastructure
- Target 9.1: “Develop quality, reliable, sustainable and resilient infrastructure…to support economic development and human well-being…” The article’s main argument is the need to invest “$3.4 trillion…to bring drinking water, stormwater and wastewater infrastructure up to date.” It notes that the “general reliability masks long-term neglect” and that systems received grades of “C- to a D,” indicating a lack of quality and resilience.
-
SDG 8: Decent Work and Economic Growth
- Target 8.5: “By 2030, achieve full and productive employment and decent work for all…” The article provides specific data on job creation, stating that “every investment of $1 million in water will create 10 jobs” and that this work pays “above national averages,” directly linking infrastructure investment to employment.
-
SDG 11: Sustainable Cities and Communities
- Target 11.1: “By 2030, ensure access for all to adequate, safe and affordable housing and basic services…” Water and sanitation are basic services. The article discusses how publicly owned systems deliver water to homes and warns that if the funding gap is filled by customers, it could mean “an extra $1,000 per year on the average household water and sewer bill,” directly impacting the affordability of this basic service.
3. Are there any indicators mentioned or implied in the article that can be used to measure progress towards the identified targets?
-
For SDG 6 & 9 (Infrastructure Quality and Investment):
- Financial Investment: The total investment required to upgrade infrastructure is a key indicator, specified as “$3.4 trillion” over 20 years. The funding gap is identified as “$2 trillion.”
- Government Funding Allocation: The proportion of government budget allocated to water infrastructure is an indicator. The article notes the decline in federal funding to “7 percent of total funding” and the “$8 billion a year” provided by the IIJA.
- Infrastructure Quality Assessment: The grades given by the American Civil Society of Engineers (“ranging from a C- to a D”) serve as a qualitative indicator of the current state of water infrastructure.
-
For SDG 8 (Economic Growth and Employment):
- Job Creation Rate: The article provides a specific metric: “10 jobs” created for every “$1 million” invested in water infrastructure.
- Economic Output: The return on investment is measured by economic output, stated as “$2.5 million in economic output” for every $1 million invested.
- GDP Contribution: The impact on the national economy is measured by the increase in GDP, specified as “$1.4 million in GDP” per $1 million investment.
-
For SDG 11 (Affordability of Basic Services):
- Household Expenditure on Water: The potential increase in the average household water bill (“an extra $1,000 per year”) is an indicator of the affordability of this essential service.
4. SDGs, Targets, and Indicators Table
| SDGs | Targets | Indicators |
|---|---|---|
| SDG 6: Clean Water and Sanitation | 6.1: Achieve universal and equitable access to safe and affordable drinking water for all. |
|
| SDG 9: Industry, Innovation and Infrastructure | 9.1: Develop quality, reliable, sustainable and resilient infrastructure. |
|
| SDG 8: Decent Work and Economic Growth | 8.5: Achieve full and productive employment and decent work for all. |
|
| SDG 11: Sustainable Cities and Communities | 11.1: Ensure access for all to adequate, safe and affordable housing and basic services. |
|
Source: governing.com
What is Your Reaction?
 Like
0
 Dislike
0
 Love
0
 Funny
0
 Angry
0
 Sad
0
Sad
0
 Wow
0
Wow
0


