


How to track the super polluters next door – CNN

Report on the Climate TRACE Initiative: A Tool for Advancing Sustainable Development Goals
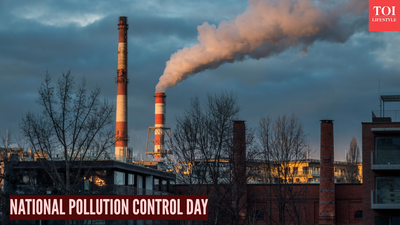
A new global tool has been launched to monitor air and climate pollution at the facility level, providing critical data that directly supports the achievement of the United Nations Sustainable Development Goals (SDGs). The initiative, developed by the Climate TRACE coalition, offers an interactive map and database that tracks greenhouse gas emissions and hazardous air pollutants, empowering communities and policymakers to take informed action.
Key Findings and Implications for Global Goals
The data reveals critical challenges to public health and environmental sustainability, highlighting the urgency of addressing several SDGs. The primary findings include:
- Identification of “Super Emitters”: The tool identifies facilities in the top 10% of PM2.5 pollution sources. These “super emitters” disproportionately impact public health, a direct concern for SDG 3 (Good Health and Well-being).
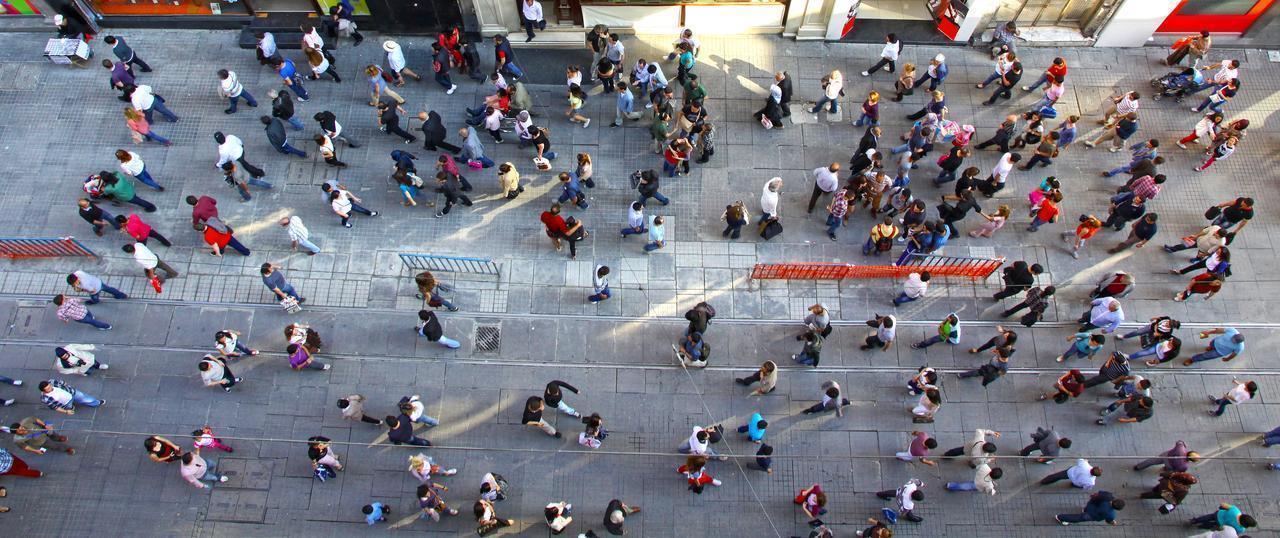
- Widespread Human Exposure: Of the 1.6 billion people living in high-pollution urban zones, approximately 900 million are exposed to pollution from these super emitters. This underscores the challenge to SDG 11 (Sustainable Cities and Communities), specifically Target 11.6, which aims to reduce the adverse per capita environmental impact of cities, including air quality.
- Global Health Crisis: Pollutants such as PM2.5 are linked to nearly 9 million deaths annually, aggravating conditions like asthma and heart disease. This data reinforces the need for robust public health interventions as outlined in SDG 3.
Alignment with the 2030 Agenda for Sustainable Development
The Climate TRACE tool is a significant asset for monitoring and implementing the 2030 Agenda. Its contributions span multiple goals by providing transparent, actionable data.
Direct Impact on Core SDGs
- SDG 3: Good Health and Well-being: By mapping pollution plumes and their sources, the tool allows for the identification of health risks at a local level, enabling targeted public health policies to reduce respiratory and cardiovascular diseases caused by air pollution.
- SDG 11: Sustainable Cities and Communities: The database provides city planners and residents with the information needed to advocate for cleaner industrial practices and transportation, fostering safer and more resilient urban environments.
- SDG 13: Climate Action: The tool’s primary function is to track greenhouse gas emissions from over 660 million sources, providing an unprecedented level of detail to hold nations and corporations accountable for their climate commitments.
Broader Contributions to Sustainable Development
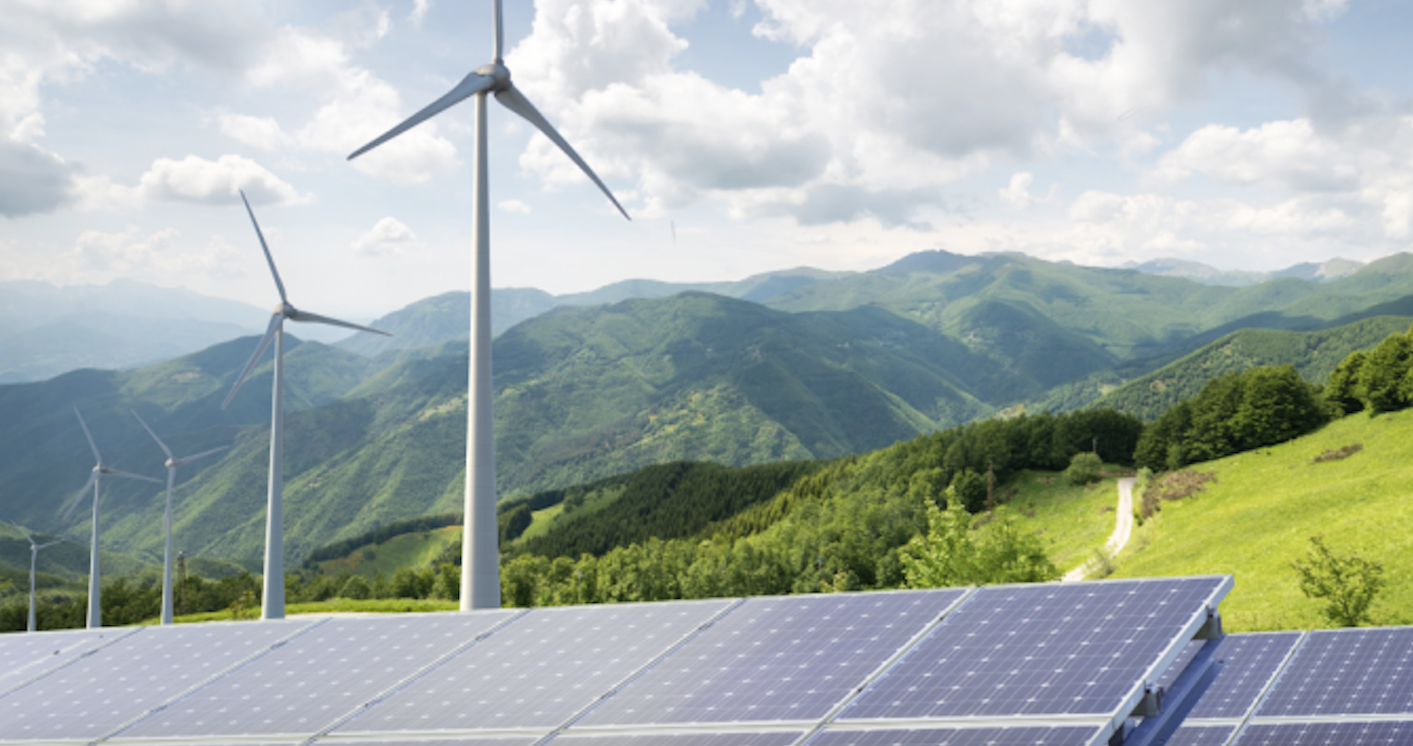
- SDG 7 (Affordable and Clean Energy) & SDG 9 (Industry, Innovation, and Infrastructure): The data identifies major polluters, including power plants, refineries, and heavy manufacturing sites. This information can accelerate the transition to cleaner energy sources and promote investment in sustainable industrial infrastructure.
- SDG 12: Responsible Consumption and Production: By exposing pollution from sources like domestic shipping, the tool highlights the environmental impact of global supply chains, encouraging more sustainable production patterns.
- SDG 16 (Peace, Justice, and Strong Institutions) & SDG 17 (Partnerships for the Goals): Climate TRACE exemplifies a multi-stakeholder partnership (SDG 17) by bringing together scientists, NGOs, and tech experts. By making its data freely available, it promotes transparency and accountability, strengthening institutions and empowering citizen action (SDG 16).
Conclusion: Data as a Catalyst for Sustainable Policy
The Climate TRACE initiative represents a breakthrough in environmental monitoring. By visualizing the direct link between major polluters, public health, and the climate crisis, it provides a powerful evidence base for policy change. The public availability of this data is intended to empower grassroots activists, researchers, and government leaders to accelerate action on climate and health, thereby advancing the global commitment to the Sustainable Development Goals.
Analysis of the Article in Relation to Sustainable Development Goals
1. Which SDGs are addressed or connected to the issues highlighted in the article?
The article discusses issues related to air pollution, climate change, public health, and access to information, which directly connect to several Sustainable Development Goals (SDGs). The following SDGs are addressed:
- SDG 3: Good Health and Well-being: The article extensively covers the health impacts of air pollution, mentioning that pollutants like PM2.5 can cause or aggravate respiratory ailments and heart disease, leading to “nearly 9 million deaths per year globally.”
- SDG 9: Industry, Innovation, and Infrastructure: The new tool tracks pollution from specific sources, including “every power plant, heavy manufacturing site, mine, port and refinery.” This highlights the role of industrial infrastructure in pollution and the need for sustainable industrial practices.
- SDG 11: Sustainable Cities and Communities: The focus of the Climate TRACE tool is on “the world’s largest metropolitan areas” and “2,500 urban areas worldwide.” It aims to track air pollution exposure within these cities, directly addressing the environmental quality of urban living.
- SDG 13: Climate Action: A primary function of the tool is to track “planet-warming pollution” and “greenhouse gases.” The article states the goal is to help people realize their health is affected by “the same facilities that are really causing the climate crisis,” thereby motivating action to address it.
- SDG 16: Peace, Justice, and Strong Institutions: The article emphasizes transparency and public access to information. It notes that “All of Climate TRACE’s emissions tracking data are available for free download to the public,” empowering “grassroots activists to government leaders” to drive policy changes.
2. What specific targets under those SDGs can be identified based on the article’s content?
Based on the issues discussed, several specific SDG targets can be identified:
- Target 3.9: “By 2030, substantially reduce the number of deaths and illnesses from hazardous chemicals and air, water and soil pollution and contamination.” The article directly relates to this target by focusing on hazardous air pollutants (PM2.5) and quantifying their lethal impact, stating they are “responsible for nearly 9 million deaths per year globally.”
- Target 9.4: “By 2030, upgrade infrastructure and retrofit industries to make them sustainable…and greater adoption of clean and environmentally sound technologies and industrial processes…” The tool identifies “super emitters” such as power plants, refineries, and heavy manufacturing sites, providing the data necessary to target these specific industries for upgrades to reduce their pollution.
- Target 11.6: “By 2030, reduce the adverse per capita environmental impact of cities, including by paying special attention to air quality…” The Climate TRACE map is designed specifically to monitor and visualize air quality in urban areas, allowing residents and policymakers to understand and address the environmental impact of pollution sources within their cities.
- Target 13.2: “Integrate climate change measures into national policies, strategies and planning.” The article expresses the hope that visualizing pollution plumes will “lead to policy changes that reduce emissions” and motivate “government leaders” to “address the climate crisis,” which aligns with integrating climate action into policy.
- Target 16.10: “Ensure public access to information…” The article highlights that the tool and its data are made publicly available for free, stating its purpose is to be “useful for public health and other researchers, as well as people interested in learning more about their region’s pollution sources.” This directly promotes public access to crucial environmental information.
3. Are there any indicators mentioned or implied in the article that can be used to measure progress towards the identified targets?
Yes, the article mentions and implies several indicators that can be used to measure progress:
- Indicator for Target 3.9 (Mortality from air pollution): The article explicitly states that pollutants are “responsible for nearly 9 million deaths per year globally.” This figure serves as a direct indicator (corresponding to SDG Indicator 3.9.1: Mortality rate attributed to household and ambient air pollution) that can be tracked over time to measure reductions in deaths from air pollution.
- Indicator for Target 11.6 (Urban air quality): The article’s central theme is the tracking of “hazardous air pollutants known as PM2.5” in urban areas. The data provided by the Climate TRACE tool on PM2.5 levels in 2,500 urban areas is a direct measurement that aligns with SDG Indicator 11.6.2 (Annual mean levels of fine particulate matter in cities).
- Indicator for Targets 9.4 and 13.2 (Greenhouse gas emissions): The tool’s database includes a “global inventory of more than 660 million sources of global warming pollutants” and tracks “greenhouse gases.” The total volume of emissions from these industrial sources is a key indicator for measuring progress in making industries sustainable and integrating climate action (corresponding to SDG Indicator 9.4.1: CO2 emission per unit of value added).
- Indicator for Target 16.10 (Public access to information): The existence and accessibility of the Climate TRACE tool itself is an indicator. The article states, “All of Climate TRACE’s emissions tracking data are available for free download to the public.” The availability and use of this free, public database on pollution serves as a tangible measure of public access to environmental information.
4. SDGs, Targets, and Indicators Summary Table
| SDGs | Targets | Indicators |
|---|---|---|
| SDG 3: Good Health and Well-being | Target 3.9: Substantially reduce deaths and illnesses from air pollution. | Mortality rate from air pollution (mentioned as “nearly 9 million deaths per year globally”). |
| SDG 9: Industry, Innovation, and Infrastructure | Target 9.4: Upgrade industries to make them sustainable and reduce emissions. | Volume of greenhouse gas emissions from industrial facilities (power plants, refineries, etc.) tracked by the tool. |
| SDG 11: Sustainable Cities and Communities | Target 11.6: Reduce the adverse per capita environmental impact of cities, focusing on air quality. | Levels of PM2.5 pollution in the 2,500 urban areas monitored by the tool. |
| SDG 13: Climate Action | Target 13.2: Integrate climate change measures into national policies. | Use of the tool’s data to inform and create policies that reduce emissions from identified sources. |
| SDG 16: Peace, Justice, and Strong Institutions | Target 16.10: Ensure public access to information. | The public availability and free download of all Climate TRACE emissions data. |
Source: cnn.com

What is Your Reaction?
 Like
0
Like
0
 Dislike
0
Dislike
0
 Love
0
Love
0
 Funny
0
Funny
0
 Angry
0
Angry
0
 Sad
0
Sad
0
 Wow
0
Wow
0