


Ozone pollution on Colorado’s Front Range hit lowest levels in 16 years this summer – Greeley Tribune
Report on Front Range Air Quality and Alignment with Sustainable Development Goals (2025)
Executive Summary
In the summer of 2025, the Front Range region recorded its lowest ground-level ozone concentrations in 16 years. Despite this improvement, the region remains in non-compliance with federal air quality standards, hindering progress toward key Sustainable Development Goals (SDGs), particularly SDG 3 (Good Health and Well-being) and SDG 11 (Sustainable Cities and Communities). Continued federal oversight necessitates stringent industrial permitting and the use of reformulated gasoline, underscoring the urgent need for sustained pollution reduction strategies.
Impact on Public Health and Sustainable Communities (SDG 3 & SDG 11)
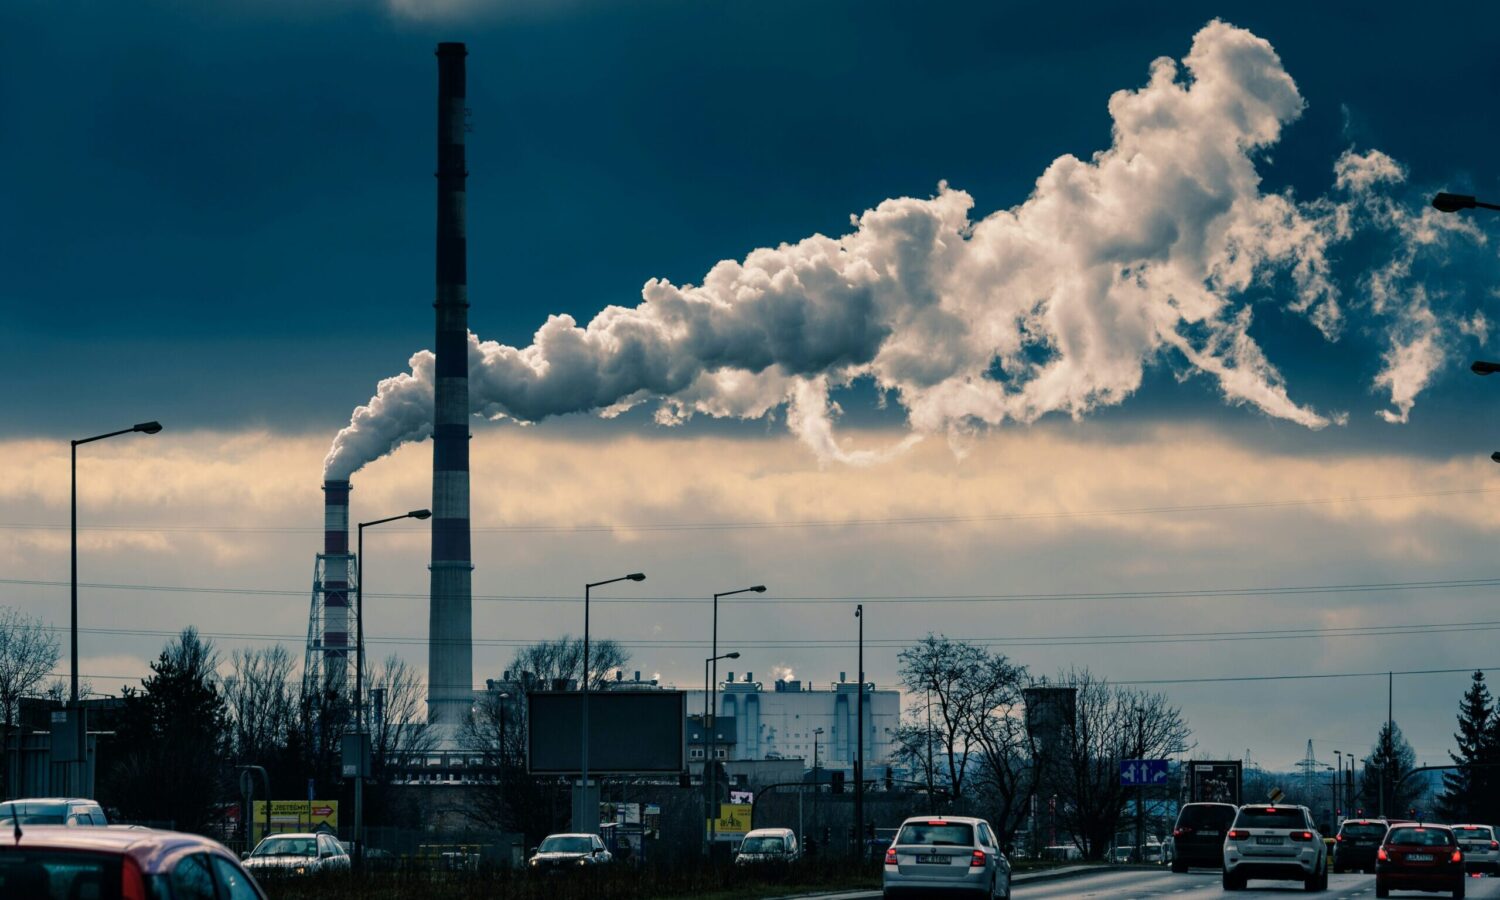
Ground-level ozone pollution presents a significant public health risk, directly impeding the objectives of SDG 3. The formation of ozone, resulting from the interaction of ultraviolet rays with volatile organic compounds and nitrogen oxides, creates hazardous smog that disproportionately affects vulnerable populations.
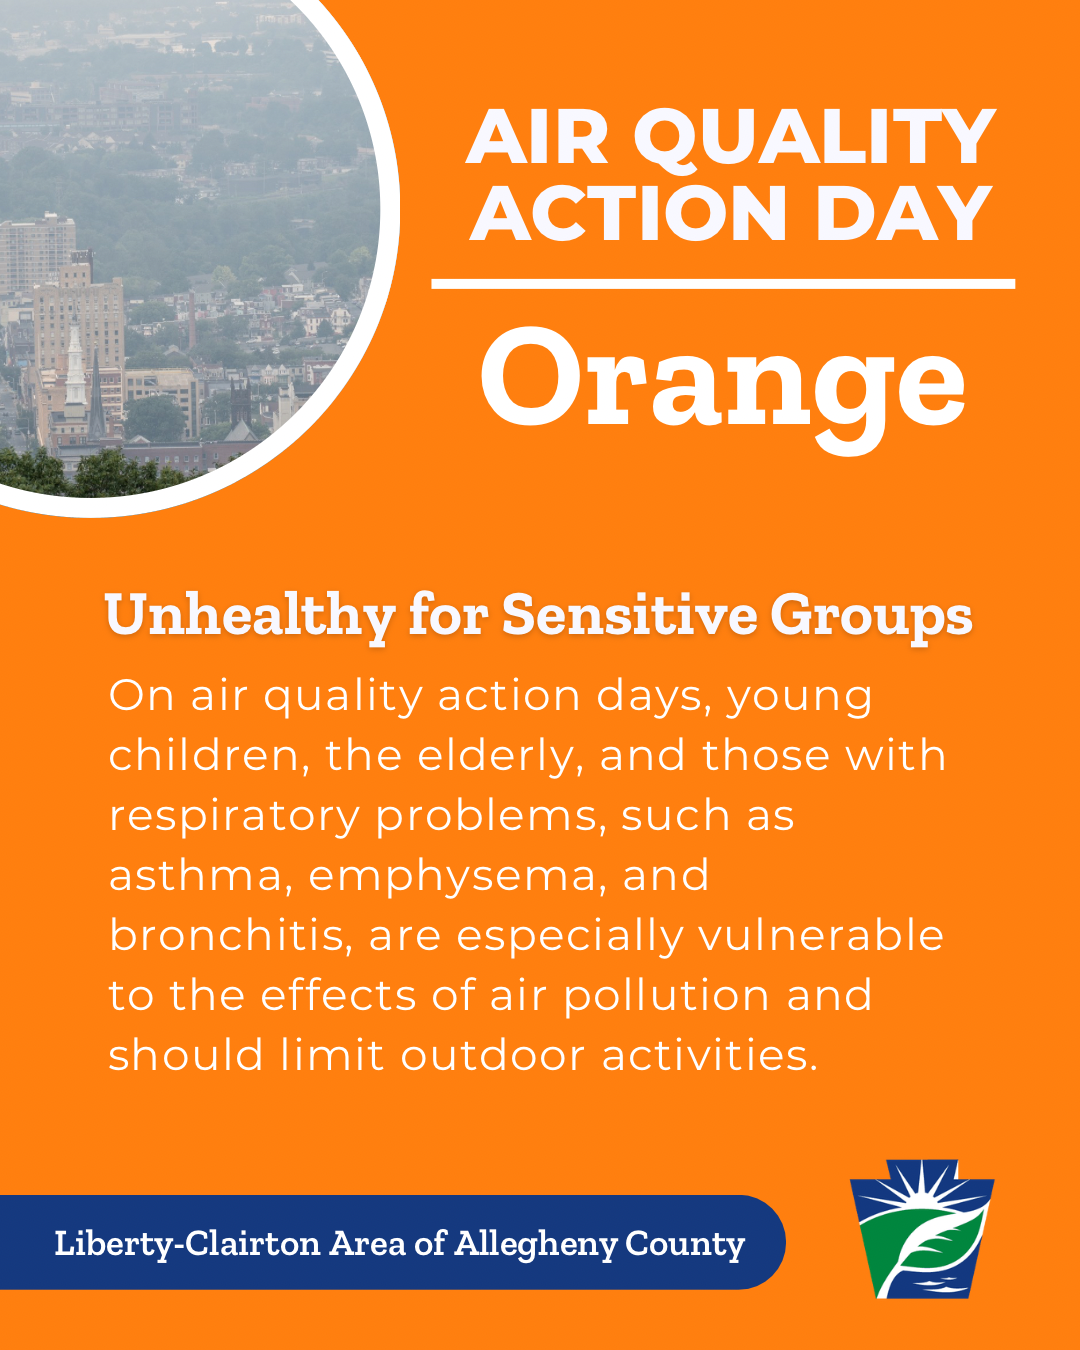
- Health Consequences: The pollution is particularly harmful to children with asthma, the elderly, and individuals with chronic respiratory conditions like COPD.
- Community Well-being: The 23 days in 2025 that exceeded federal standards represent a direct threat to community health and the creation of safe, resilient, and sustainable urban environments as outlined in SDG 11.
- Public Alerts: The Colorado Department of Public Health and Environment issued 33 air quality alerts during the season, advising residents to limit activities that contribute to pollution, such as driving.
2025 Ozone Season Performance Analysis
The 2025 season showed a marked improvement in air quality, largely attributed to favorable meteorological conditions that prevented the formation of stagnant, hot air masses conducive to ozone creation. However, the region’s air quality remains a persistent challenge.
- Reduced Exceedances: The region experienced 23 days where ozone levels surpassed federal standards, a significant decrease from the 41 days recorded in 2024.
- Historical Low: This marks the lowest number of ozone exceedance days for the region since 2009.
- Effectiveness of Controls: The number of official alerts (33) exceeded the number of actual high-pollution days (23), suggesting that state-implemented pollution control programs are contributing positively to air quality management.
Regulatory Compliance and Non-Attainment Status
The Front Range is failing to meet two critical air quality standards set by the U.S. Environmental Protection Agency (EPA), placing it in a state of “severe non-attainment” and triggering federal interventions.
- 2008 Standard (75 parts per billion): The region achieved a “clean data year” in 2025, with only six days exceeding this standard. This is the first time this benchmark has been met since 2017. However, compliance requires a sustained three-year average, a target that remains unlikely due to high pollution levels in previous years.
- 2015 Standard (70 parts per billion): Considered the benchmark for protecting human health, this standard was exceeded on 17 days in 2025. The state has requested the EPA to formalize its “severe non-attainment” status for this standard, which will maintain strict federal regulations.
Strategic Partnerships and Future Actions (SDG 17)
In alignment with SDG 17 (Partnerships for the Goals), collaborative efforts are underway to develop more effective, data-driven policies for air quality improvement. These actions are critical for long-term progress on environmental and health goals.
- Collaborative Research: The Regional Air Quality Council, the state health department, and Colorado State University have launched the first major air quality study since 2014 to improve atmospheric modeling and pollution measurement.
- Policy-Informed Science: Research teams are actively analyzing the complex atmospheric chemistry of the Front Range to provide actionable data that can be translated into effective pollution control policies.
- Long-Term Outlook: The region will operate under federal restrictions for the foreseeable future. Ongoing scientific research and policy implementation are essential to reduce pollution, protect public health, and advance the region’s commitment to the Sustainable Development Goals.
Analysis of Sustainable Development Goals in the Article
1. Which SDGs are addressed or connected to the issues highlighted in the article?
The article on air quality in the Front Range connects to several Sustainable Development Goals (SDGs) by focusing on environmental health, urban living conditions, and regulatory actions to mitigate pollution.
-
SDG 3: Good Health and Well-being
This goal is directly addressed as the article explicitly states that ground-level ozone pollution “is harmful to people, especially children with asthma, the elderly and others with breathing conditions such as chronic obstructive pulmonary disease.” The entire effort to reduce ozone levels is fundamentally a public health initiative aimed at preventing illness caused by air pollution.
-
SDG 11: Sustainable Cities and Communities
The article’s focus is on the “nine-county region” of the Front Range, an urban and suburban area. The core issue is managing air quality to make this region more livable and sustainable. Efforts to reduce air pollution, monitor its levels, and comply with federal standards are central to creating a healthier urban environment.
-
SDG 9: Industry, Innovation, and Infrastructure
This goal is relevant through the discussion of industrial regulation and scientific innovation. The article mentions that federal oversight requires “more stringent permitting for polluting industries,” pushing them toward cleaner processes. Furthermore, the launch of a “new air quality study with the state health department and Colorado State University to figure out how to build better models” represents an investment in scientific innovation to tackle the pollution problem.
-
SDG 13: Climate Action
While the article focuses on ground-level ozone, a local air pollutant, its precursors—”volatile organic compounds and nitrogen oxides”—are often byproducts of fossil fuel combustion, the primary driver of climate change. Therefore, policies and actions taken to reduce ozone, such as requiring “reformulated gas” and regulating industrial emissions, are aligned with broader strategies to combat climate change by reducing reliance on and the impact of fossil fuels.
2. What specific targets under those SDGs can be identified based on the article’s content?
Based on the issues discussed, several specific SDG targets can be identified:
-
Target 3.9: Substantially reduce deaths and illnesses from hazardous chemicals and air pollution
The article’s entire premise is centered on reducing the health impacts of air pollution. The efforts to meet the Environmental Protection Agency (EPA) standards of 75 and 70 parts per billion for ozone are direct actions to reduce illnesses from this hazardous pollutant, as mentioned in the text.
-
Target 11.6: Reduce the adverse per capita environmental impact of cities, including by paying special attention to air quality
This target is the most prominent in the article. The monitoring of ozone levels, the comparison of “bad ozone days” year over year (23 days this summer vs. 41 in 2024), and the implementation of federal and state pollution control programs are all measures aimed at reducing the adverse environmental impact of the Front Range urban area, with a specific focus on air quality.
-
Target 9.4: Upgrade infrastructure and retrofit industries to make them sustainable… with greater adoption of clean and environmentally sound technologies and industrial processes
The article points to this target by mentioning that the region’s “severe non-attainment” status leads to “more stringent permitting for polluting industries.” This regulatory pressure forces industries to adopt cleaner processes to reduce their emissions, directly contributing to this target.
3. Are there any indicators mentioned or implied in the article that can be used to measure progress towards the identified targets?
Yes, the article provides several explicit quantitative and qualitative indicators that can be used to measure progress.
-
Quantitative Indicators for Air Quality (Targets 3.9 and 11.6)
The article is rich with specific data points that serve as direct indicators of air quality:
- Number of days exceeding federal air quality standards: The article reports this number was 23 in the current summer, down from 41 in 2024, indicating year-over-year progress.
- Specific ozone concentration levels: The EPA standards of “75 parts per billion” (2008 standard) and “70 parts per billion” (2015 standard) are used as official benchmarks for measuring air quality.
- Frequency of exceeding specific benchmarks: The text notes that “only six days exceeded that [75 ppb] standard this summer” and “Seventeen days in 2025 exceeded that [70 ppb] standard.” These are precise metrics for tracking compliance.
- Three-year average compliance: The article mentions that the state “must maintain those levels on a three-year average,” which is a longer-term indicator of sustained improvement.
-
Process and Policy Indicators (Targets 9.4 and 11.6)
The article also implies several process-based indicators that measure the implementation of pollution control efforts:
- Issuance of air quality alerts: The fact that the “division issued 33 alerts” is an indicator of the state’s active monitoring and public information system. The article suggests that the higher number of alerts compared to actual exceedance days indicates that control programs are working.
- Implementation of regulations: The requirement for motorists to use “reformulated gas” and the increase in “businesses that must apply for permits to pollute” are indicators of policy implementation aimed at reducing emissions from transport and industry.
- Investment in research and innovation: The launch of a “new air quality study… to build better models and ways to measure the pollutants” is an indicator of investment in the scientific capacity needed to inform future policy.
4. Table of SDGs, Targets, and Indicators
| SDGs | Targets | Indicators |
|---|---|---|
| SDG 3: Good Health and Well-being | Target 3.9: By 2030, substantially reduce the number of deaths and illnesses from hazardous chemicals and air, water and soil pollution and contamination. |
|
| SDG 11: Sustainable Cities and Communities | Target 11.6: By 2030, reduce the adverse per capita environmental impact of cities, including by paying special attention to air quality and municipal and other waste management. |
|
| SDG 9: Industry, Innovation, and Infrastructure | Target 9.4: By 2030, upgrade infrastructure and retrofit industries to make them sustainable… with greater adoption of clean and environmentally sound technologies and industrial processes. |
|
| SDG 13: Climate Action | Target 13.2: Integrate climate change measures into national policies, strategies and planning. |
|
Source: greeleytribune.com

What is Your Reaction?
 Like
0
Like
0
 Dislike
0
Dislike
0
 Love
0
Love
0
 Funny
0
Funny
0
 Angry
0
Angry
0
 Sad
0
Sad
0
 Wow
0
Wow
0